Profitable binary options trading is impossible without the ability to determine the trend in the market . In addition, it is important to understand what phase the market is currently in, and if you spend some time studying this issue, then any trader will be able to correctly determine the phases of the trend and see points for buying options that are most likely to bring profit.
What is an uptrend and a downtrend?
A trend (upward or downward, bullish or bearish ) is the predominant direction of the price, up or down, with constant updating of extremes. A trend can also be called a trend, but a trend most often occurs before the emergence of the main trend.
In the image below you can see the GBP/USD currency pair and two main types of trend (upward and downward) on the M5 timeframe :
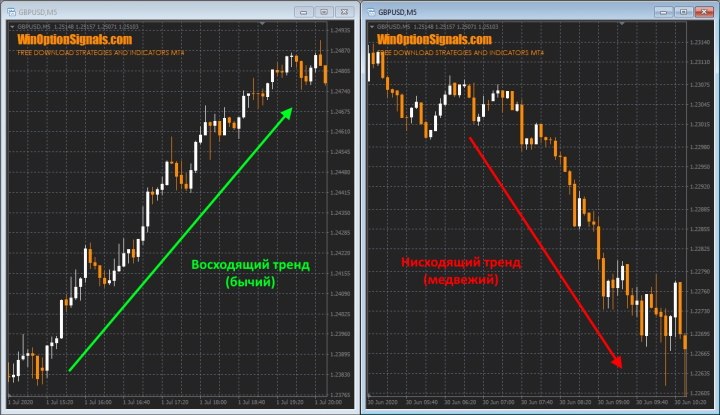
Accordingly, during an uptrend the price rises and updates previous price highs. An uptrend can also be called a bullish trend or uptrend.
A downtrend, on the contrary, is completely opposite to an uptrend and during this trend the price updates previous lows. A downtrend is also called a bearish or downtrend.
There is a third type of trend, which is called a sideways trend (flat) . In this trend, the price is in a sideways corridor and does not update important highs or lows:

And as you can see from the example, even if the price goes out of bounds, it almost immediately returns back to the range and continues to trade within it. A sideways trend can also be called “sideways”. And speaking of flats, according to statistics, most of the time the price is in this type of trend.
Why is it important to trade binary options with the trend?
Many traders know the expression “trend is your friend”. This expression means that it is most profitable for any trader to trade binary options according to the trend, since such market behavior is the easiest to predict. When the market moves in one direction, all that remains is to follow it and miss signals from strategies or indicators that are opposite to the current trend. Therefore, no matter what approach is used in trading, it is always important to take into account the price direction on any timeframe and instrument.
If you need trend strategies for binary options, then one example of trend strategies is the well-known “Elder's Three Screens” trading, as well as a more convenient and improved option – the PPA indicator .
Trend phases: accumulation and distribution
Trend phases are important to understand for all traders, as they work the same on any timeframe, from minute to monthly. This is explained by the fact that all markets move the same way and the same principle works everywhere - supply and demand:
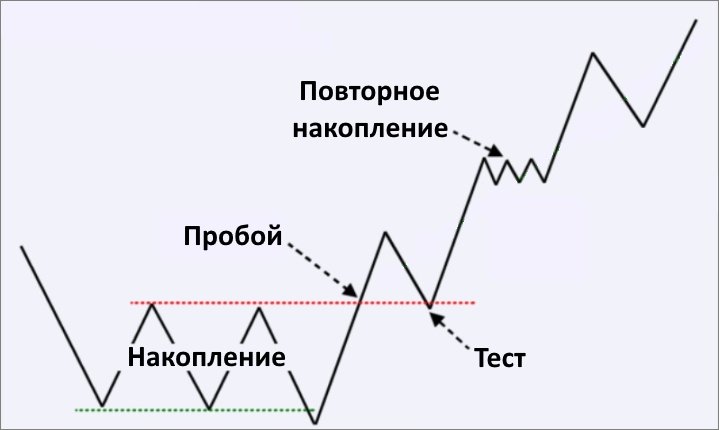
There are only two phases of a trend – accumulation and distribution. These phases are universal for both uptrends and downtrends. Next, we will consider the operating principle of each phase separately.
Accumulation
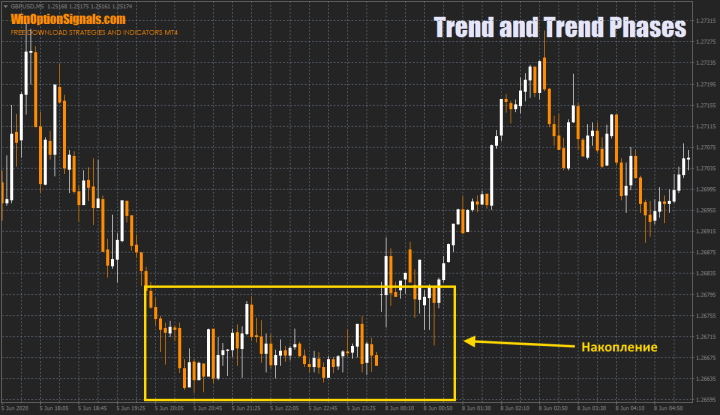
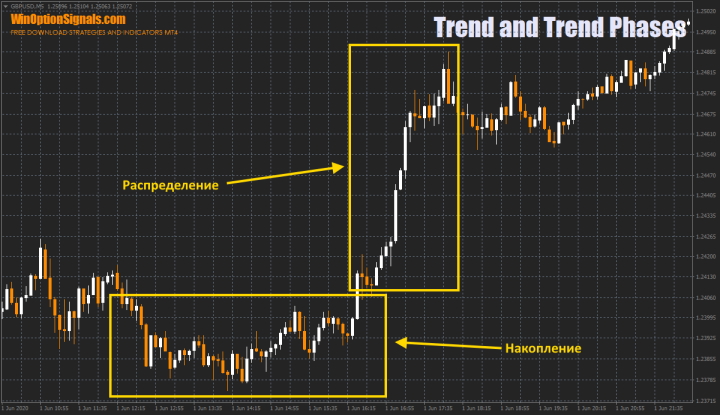
The first phase is always considered accumulation, since at this moment most often the “big player” collects his huge trading position, because it is impossible, for example, to buy 1,000,000 shares or 50,000 futures in one click. In 90% of cases, the accumulation phase occurs during the flat:
Of course, during moments of accumulation, ordinary traders, based on their assumptions, also make transactions using various types of orders, but as we know, most traders will make transactions precisely against the upcoming movement.
Note: This accumulation and distribution applies only to real exchanges and does not apply to Forex brokers or binary options brokers , as they trade internally without transactions between buyers and sellers.
Distribution
After accumulation there is always a distribution phase. Distribution can be called the phase when an asset is distributed among market participants (that is, someone sells a large volume to many who want to buy and vice versa). According to the erroneous opinion of most traders and Internet resources, the distribution phase is the following moment:
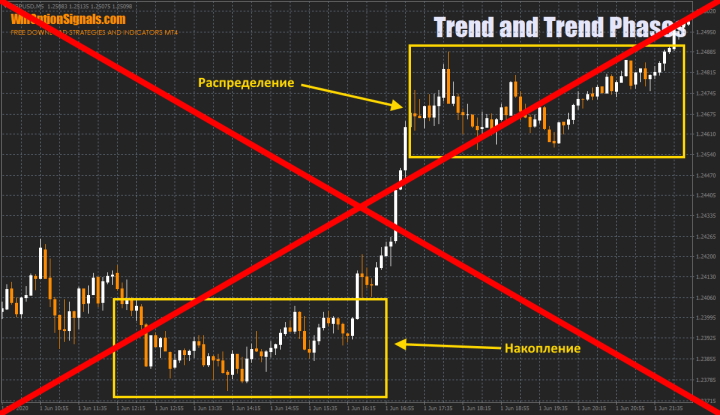
But in fact, this is only partly correct. The thing is that the so-called “big player” begins to sell (distribute) the accumulated position immediately after exiting the flat (that is, at the beginning of the trend) and he does this, of course, in parts, because selling/buying a huge volume, as already As stated earlier, it is not possible in one click and in most cases the final distribution occurs before the onset of a new flat. The formation of a new flat will almost always indicate the beginning of a new accumulation. Here's what the actual distribution usually looks like:
Distribution will occur throughout the upward movement in small parts, until the “big player” finds a place of accumulation of large liquidity in order to finally sell the entire accumulated position.
Of course, the distribution can last during a new flat, but only the remainder will be distributed there, since the main volume of the “big player” will always try to sell/buy during the trend.
During a strong trend, distribution can also be only partial and a new flat will act as a repeated accumulation.
Note: For a downtrend, the accumulation and distribution phases work in a similar way.
How to determine the beginning and end of trend phases
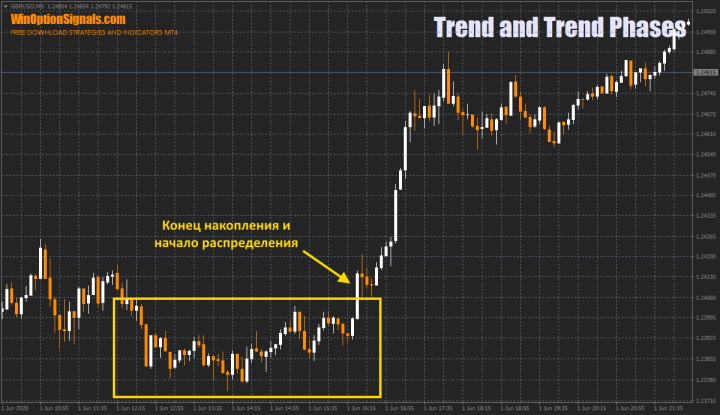
The accumulation phase, as mentioned above, almost always occurs during a flat, so determining its beginning is not difficult. To determine the end of the accumulation phase, it is enough to find the moment when the price leaves the flat. At the same moment, the distribution phase begins:
You can easily determine the end of the distribution even using tick volumes (although for this it is better to use real volumes ):
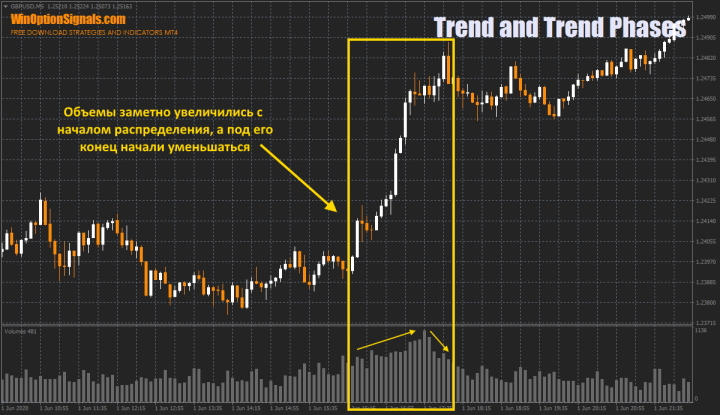
As you can see, during the trend and distribution, volumes grew, and at the end of the trend, when everything (or almost everything) was distributed, volumes began to fall and eventually became low again at the time of the new flat.
Trend and time frames in binary options
All trends can be divided into:
- short-term;
- mid-term;
- long-term.
Therefore, on different timeframes you can observe trends of different strengths. One of the rules of trend trading says that you should always follow the global trend or movement on a higher timeframe. Of course, it makes no sense to trade, for example, on M5, and at the same time look at the trend of the weekly chart, but for the same time period M5 it will be very important to observe the trend on M15-H1.
If we talk about scalping with binary options on M1 and transactions with expiration in 60 seconds, then you can not observe the trend on other timeframes, since such transactions are very fast and even with the strongest trend, short rollbacks always occur.
Conclusion
Now it becomes clear that trading binary options with a trend can generate the greatest income. And this applies not only to BO, but to any market, be it Forex, stocks or cryptocurrencies . Therefore, every trader, and especially a beginner, should spend time studying the trend and practice the ability to determine the phases of the trend, since such knowledge in the future can bring decent profits if used correctly.

See also:
What novice traders need to know about binary options
Current bonuses and promotional codes for 2022
Will binary options be closed in Russia in 2022?
To leave a comment, you must register or log in to your account.