Trading binary options attracts many, and this is not surprising, because here you can get really quick profits in a short time. But why doesn't everyone succeed in making money on binary options ? The mistake lies in not understanding the scope of this business, because before you start trading binary options, you need to study the basics, learn how to conduct technical analysis , and only then enter into transactions. Most traders do the opposite.
Basics for Analyzing Binary Options Charts
Due to the fact that beginners in trading do not know how to “read” charts, 90% of traders, and maybe even more, lose money. To avoid such mistakes, you always need to understand what you are going to do, and trading is no exception. Having learned the basics, you can already reach a more advanced level, which will distinguish you from a beginner.
Looking at a price chart, many people believe that it is impossible to predict where the price will go at a certain point in time and the market is full of chaotic movements, but in reality this is not the case. Price formation is influenced by a number of factors:
- internal and external economies of countries;
- political factors;
- force majeure situations (earthquakes, floods, terrorist attacks, wars).
But despite the above factors, it is the traders who move the price, who are the main link between pricing. The ratio of sellers and buyers determines the cost of goods, currency pairs , and cryptocurrencies . The actions of people around the world are cyclical, and most traders behave in a very similar way, driven by emotions such as fear, greed and hope. Therefore, it is possible to predict price movements if you understand the processes that influence them.
For technical analysis of asset prices, you need to use charts. There are different types, more than 10 of them, but most often brokers offer the following:
- line;
- boundaries;
- Japanese candles;
- bars.
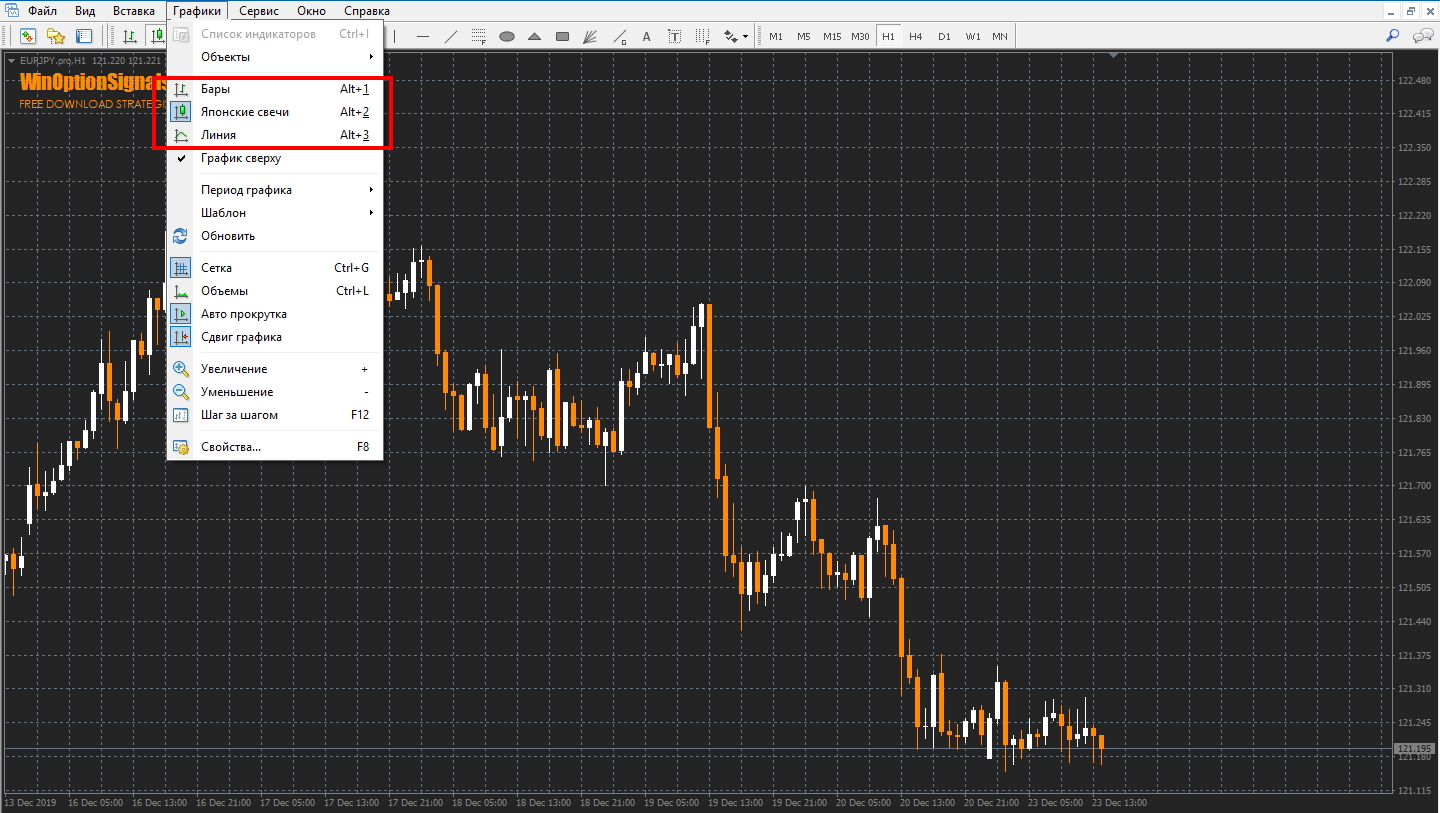
It makes sense to analyze charts only on Japanese candlesticks or bars. Other types of graphs are suitable for other types of analysis that are not widely used. Candlestick charts are considered the most informative and allow you to analyze the market much easier and faster. And for beginners, candles are more visually understandable.
To begin to understand what is happening with a certain asset, you need to learn to “read charts.” It’s worth starting with what a trend is and what types of trends there are .
Types of trends
If you learn to determine what the current trend is in a certain market, you will be able to close more trades with a profit.
A trend is a price movement in a certain direction over a long period of time. There are three types of trend:
- ascending (bullish);
- downward (bearish);
- side (flat) .
Entering a trade at the very beginning of a trend is not so easy, because more often the market is in a flat. At such moments, it is better not to make transactions, as the risk of a loss increases. Most traders lose their deposit because they are trying to make money in any situation and at any time. But this approach is extremely wrong. To reduce risks, you should adhere to the following rules:
- Trade during the American and European trading sessions .
- Follow the economic calendar so as not to trade during the release of important news.
Regarding trading sessions, it is at this time that the largest and most important trading operations around the world take place, so this fact should not be neglected. And the economic calendar will help you avoid moments of increased volatility , which can lead to losses.

Uptrend
The image below shows an uptrend where the price has been steadily rising over time:
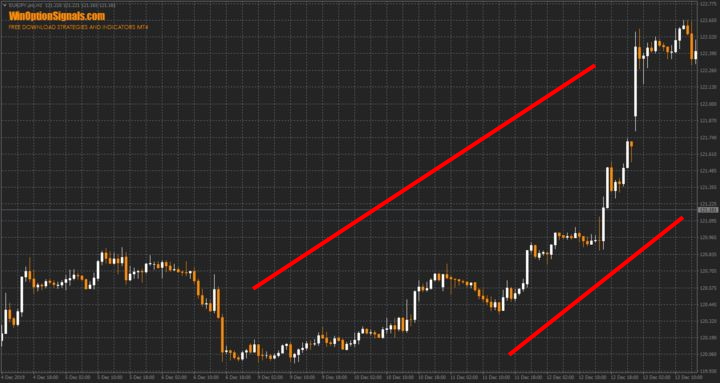
Of course, it cannot be that the price will rise indefinitely. There are always corrections and pullbacks in the market because at some point certain traders decide that it is time to sell or close their open positions. Therefore, if you see this type of trend, then you can try to look for opportunities to open a Call option.
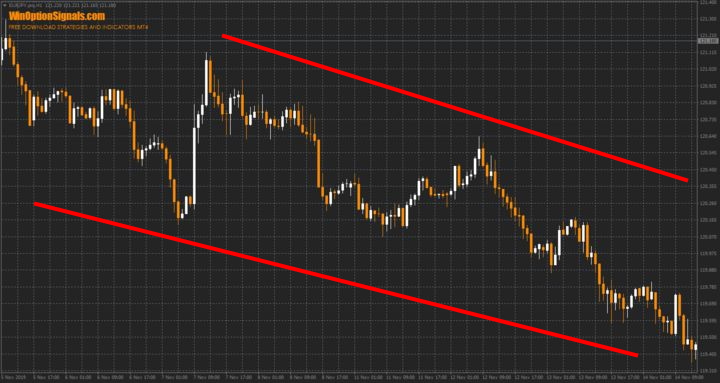
Downtrend
Everything is the same as with an uptrend, only on the contrary – the price goes down:
Flat
Flat is also called uncertainty. It is formed when both sellers and buyers are satisfied with the value of the asset. As a result, there is no directional movement in one direction. As soon as the price breaks out of the price corridor, we can most likely say that a trend has begun:
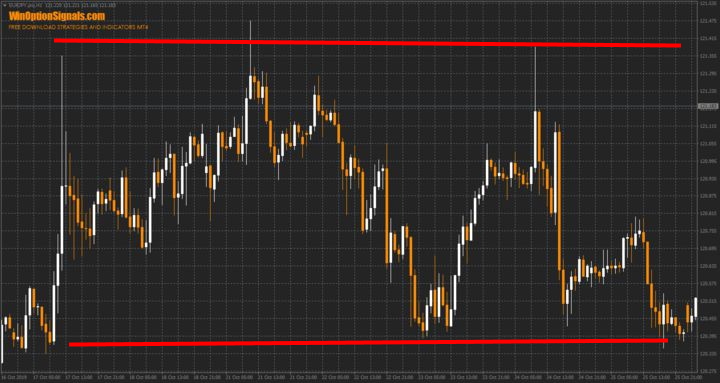
During a flat, it is better not to make transactions, but if there is a need for this, then it is better to work from the borders of the corridor. Don't forget that the biggest profits are made during a trend, so it's best to wait for it.
U-turns
It is worth mentioning a little about trend reversals:
Unfortunately, there are no exact rules for how to determine a reversal, so making trades in order to catch a reversal carries great risks. But there are several approximate rules for determining a reversal:
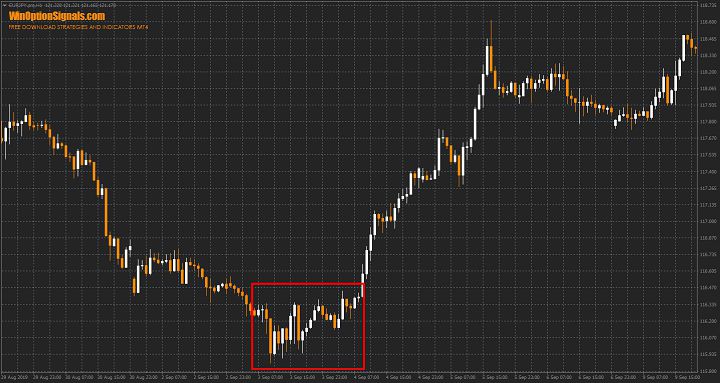
- Pinbar with a long tail at the end of the move.
- A large candle at the end of a movement, after which there may be several small candles in the same direction.
- Flat.
Do not forget that these are only approximate rules, and they do not guarantee that you will catch a full-fledged trend reversal.
Gaps
The gap will not be noticeable on a line chart, but on bars and candles it can be seen without problems. A gap is a gap between quotes or empty space:
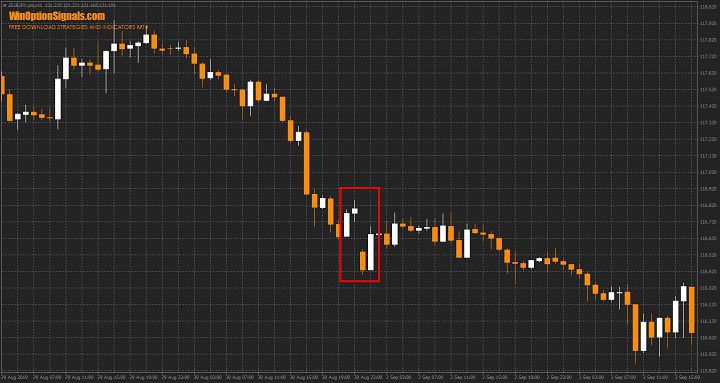
Gaps usually appear after the weekend at the market open on Monday. This almost always happens because of some fundamental factor. But gaps can appear at any other time, accompanied by increased volatility, for example on news.
There is a gap trading strategy , but for beginners it is better not to make any trades at this time.
Increased volatility
Most often, candles are approximately the same size, but if there are spikes in volatility, one candle can move many more points in the same time. You can often see this on the news.
At such moments, it is better to wait and not open trades even for experienced traders, since the news can be very unpredictable.
Timeframes
When analyzing prices, it is important to choose the right time frame . If you use a certain strategy, then, as a rule, all the necessary time frames are spelled out in it:
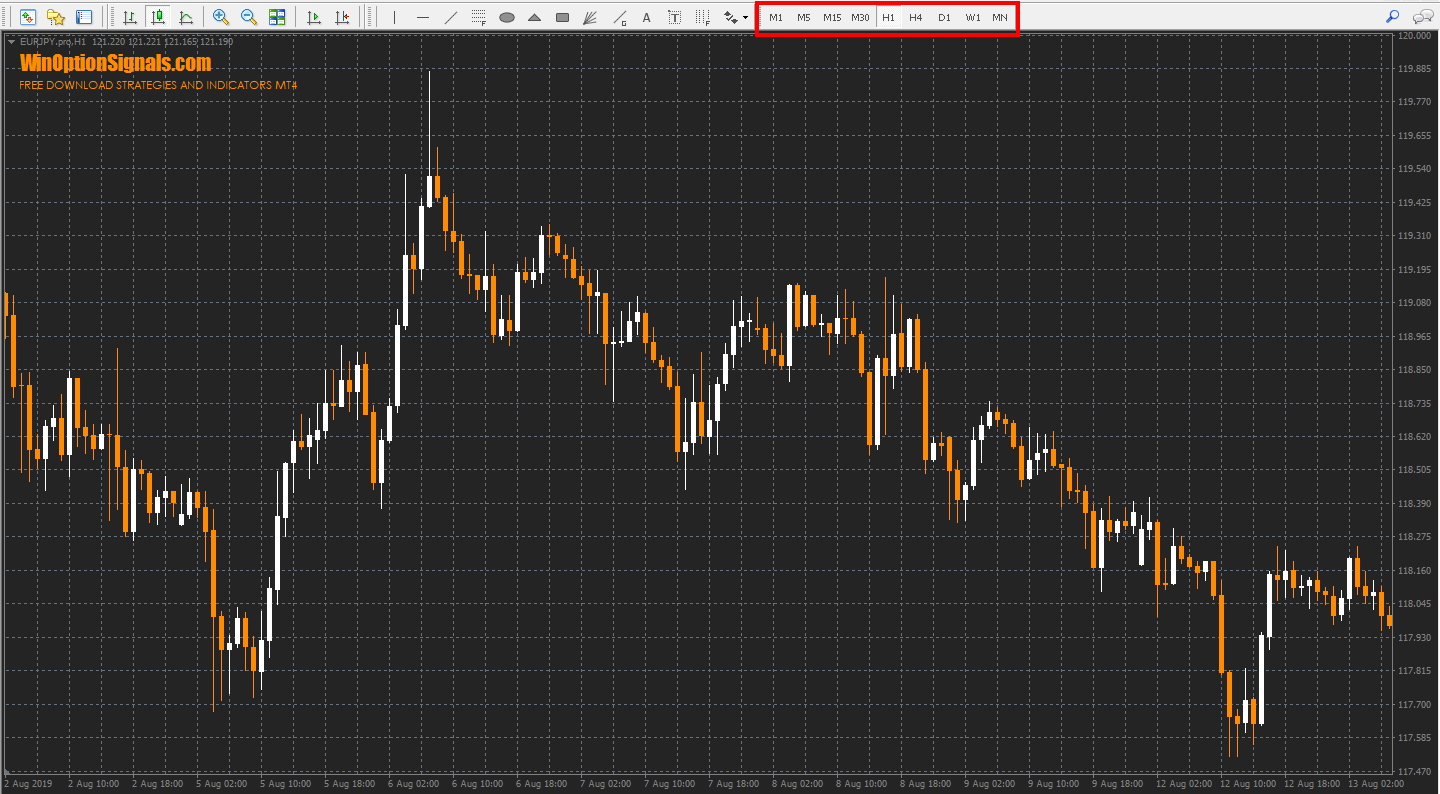
If you like short and fast transactions with expiration from 1 to 5 minutes, then the M1 (1 minute) or M5 (5 minutes) chart is suitable for you. Such timeframes are suitable for binary options scalping .
If you like more conservative trading with an expiration of 30 minutes and above, then choose charts from M30 (30 minutes) and above.
Conclusion
Any novice trader can easily start “reading” binary options charts. It may be difficult at first to understand where the trend is and where the flat is, but over time and with new experience you will learn to immediately identify any type of trend without any auxiliary tools.
For training, it is best to use a demo account , as it will save you from unnecessary losses and provide the same trading conditions. If, in the long term of training and training, you can close 75% of transactions in profit, you can safely switch to a real account. To choose a broker, you can use our rating of binary options brokers .
Study and train, and luck will definitely smile on you!

See also:
To leave a comment, you must register or log in to your account.