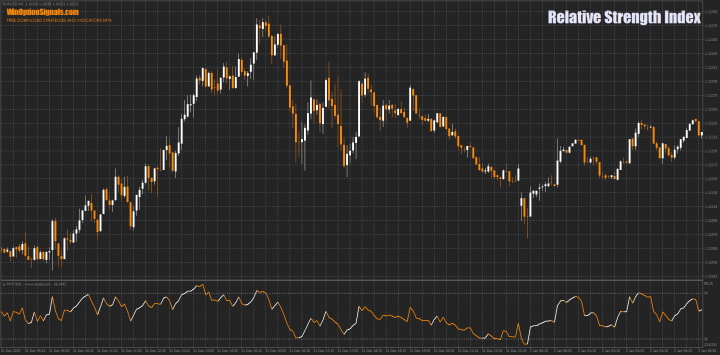
The Relative Strength Index was created by J. Wells Wilder in 1978. This indicator belongs to the oscillator type indicators and shows the speed and change in price fluctuations. RSI has a range for calculation from 0 to 100. As Wilder stated, the indicator should be considered overbought when its line is above the level of 70, and oversold when the line is below 30. There are other signals that this indicator gives, we will discuss them below. In addition, RSI can be used to determine the current trend.
The Relative Strength Index is quite popular among binary options traders who like to trade impulse price movements. This indicator is also often used in books. For example, Constance Brown's book Technical Analysis for Traders gives the concept of bull and bear market ranges for the RSI.
Even though the Relative Strength Index indicator was created before the advent of computers, they still remain very popular among many practicing traders.
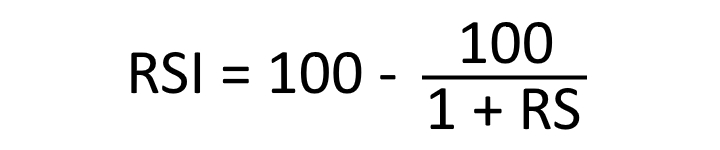
Formula for calculating the Relative Strength Index indicator
The indicator data is calculated using the following formula:
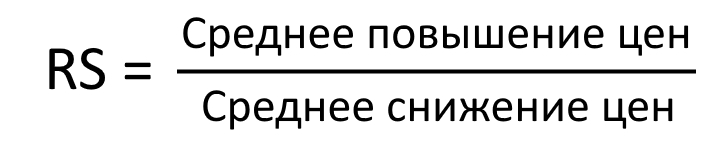
To make the formula more understandable for everyone, the indicator was divided into its component components: RS, average price increase and average price decrease. This calculation uses the period “14”, which is proposed by the author as the default period. The decrease is used in the formula as a positive value.
The first calculations for average increases and decreases are the averages of the last 14 time periods:
- First average price increase = total increase over the last 14 periods / 14.
- First average price decline = total decline over the last 14 periods / 14.
The second and next calculations are the previous average and current price increases and decreases:
- Average increase = [(previous average increase) * 13 + current increase] / 14.
- Average decline = [(previous average decline) * 13 + current decline] / 14.
The addition of previous and current values is called the smoothing method. The same method is used in moving averages. Accordingly, the higher the indicator calculation period, the more accurate it is.
Wilder's formula turns the RS into an oscillator, which has a range of fluctuations from 0 to 100. The RS chart is almost the same as the RSI chart. And since RSI is range bound, the normalization step makes it easier to identify extremes. When the average increase in prices is 0, the RSI is also 0. If you use the period "14" in the RSI indicator settings, then the 0th RSI value will mean that prices have decreased in all 14 periods, and there was no point in the measurement. The RSI is 100 when the average decline is 0. In this case, prices rose in all 14 periods and there were no declines to measure.
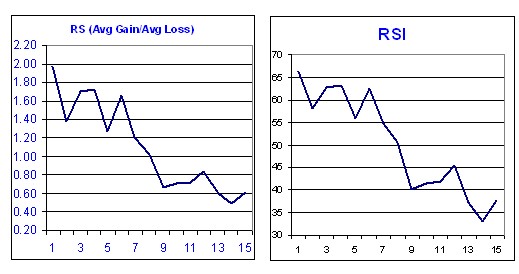
This is how the indicator is calculated in action:
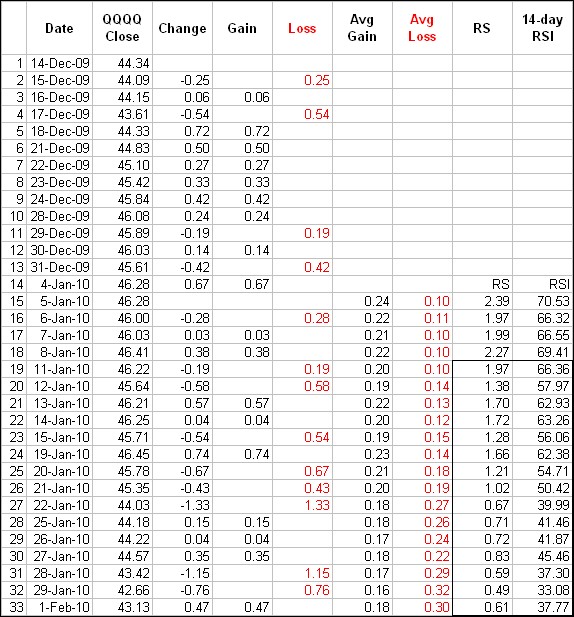
The smoothing process affects RSI values. RS values are smoothed after the first calculation. The average reduction is equal to the total reduction divided by 14 for the first calculation. Subsequent calculations multiply the previous value by 13, add the most recent value, and then divide the resulting value by 14. This creates a smoothing effect. The same applies to average price increases. Because of this smoothing, RSI values may differ depending on the overall calculation period. 250 periods smooth more than 30 periods, and this has a slight effect on RSI values.
Characteristics of the Relative Strength Index indicator
- Terminal: MetaTrader 4 .
- Time frame: from M1 and above.
- Expiration: from 1 minute and above.
- Types of options: Call/Put.
- Indicators: Relative Strength Index.
- Trading instruments: Any.
- Trading hours: 9:00-17:00.
- Recommended brokers: FiNMAX , PocketOption .
Installing the Relative Strength Index Indicator in MT4
The standard period settings for the RSI indicator are “14”. The parameter can be decreased, which will increase sensitivity, or increased, which will decrease sensitivity. With a period value of “10”, the indicator will reach levels of 30 or 70 faster than with a period value of “20”. The volatility of a trading asset also has an impact on the indicator.
If the indicator is above 70, then it is in the overbought zone, and if below 30, then it is in the oversold zone. These level values are standard, but they can be changed for more accurate indicator signals. Values of 20 and 80 will give much fewer signals, which may be a priority for conservative traders. Short-term traders can use the "2" period to look for overbought levels above the 80 level and oversold values below the 20 level.
The indicator is installed as standard in the MetaTrader 4 terminal.
To avoid setting up the chart yourself, at the end of the article you can download this indicator and a template for it.
Instructions for installing indicators in MetaTrader 4:
Examples of trading using the Relative Strength Index indicator
There are different types of indicator signals. We will look at the most popular:
- Overbought and oversold zones.
- Divergences.
- Trend identification.
The RSI indicator is universal and can be used on any time frames and assets. Therefore, settings are selected individually to suit your trading style. We will consider examples on the EUR/USD currency pair for intraday trading, using the M5 chart and expiration 15 minutes.
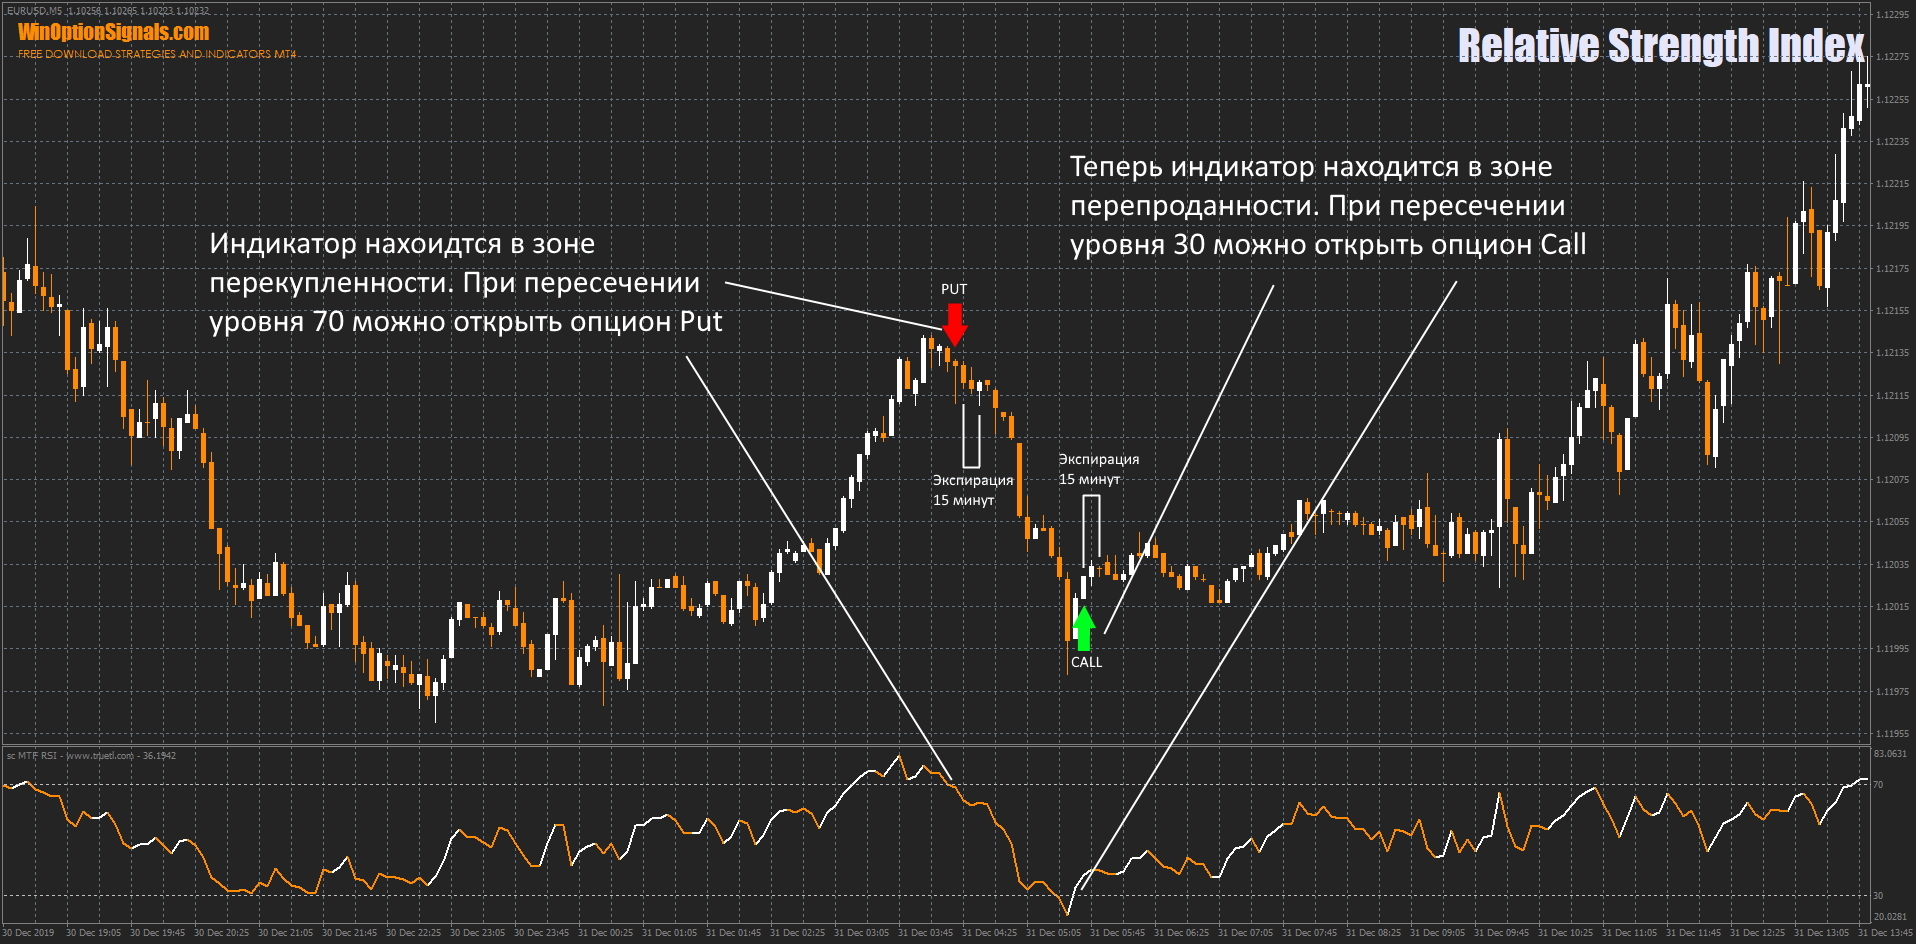
Overbought and oversold zones of the Relative Strength Index indicator
Levels 30 and 70 were given by the author of the indicator, and are still used as standard levels to this day. From the examples it will be clear that despite the passage of years, these levels still show good results and do not need to be changed.
Opening Call and Put options
Like many other momentum oscillators, the overbought and oversold levels of the RSI work best when the price is in a flat. In this example, there is not quite a standard flat, but still prices moved within a certain range.
Indicator divergences
According to Wilder, divergences tell us about a possible reversal because the directional momentum does not confirm the price movement.
Articles about the Power Fuse binary options indicator and the MACD divergence indicator show and explain how divergences work in more detail. All the principles given there will work for the Relative Strength Index indicator.
Opening Call and Put options
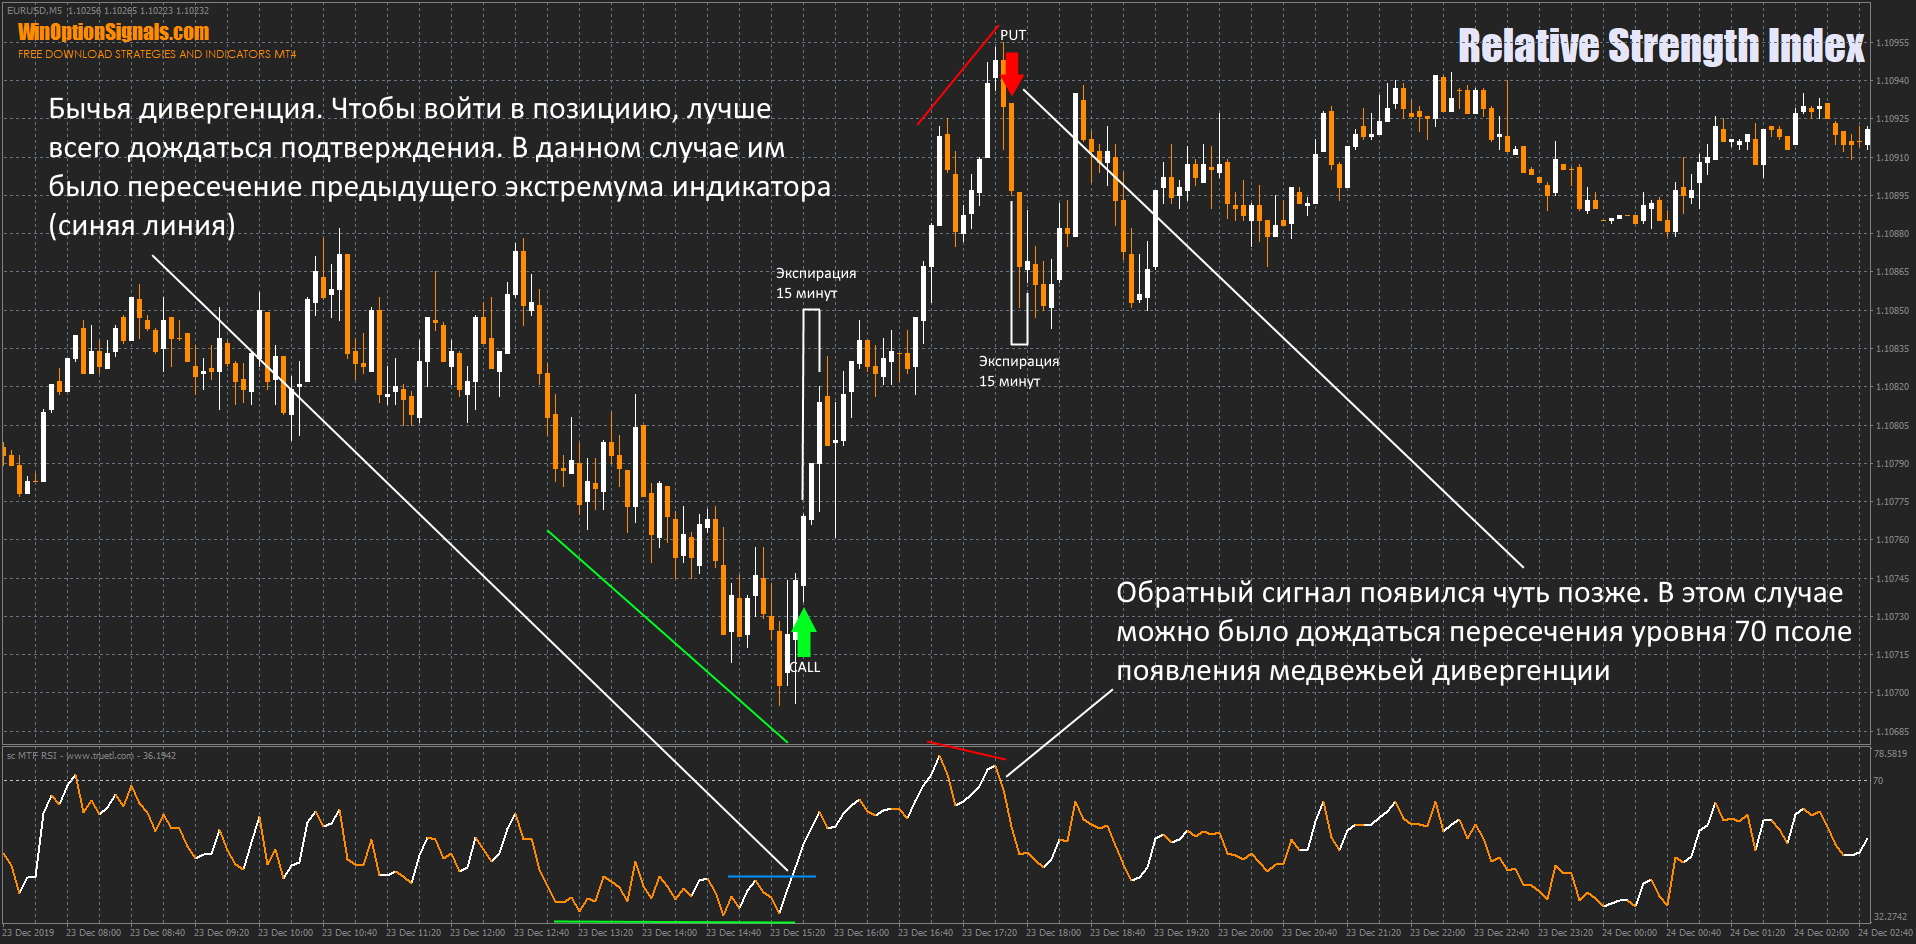
It is worth noting that you should not place high hopes on divergences. They can easily confuse you in a strong trend. A strong move can produce many bearish divergences before the trend reverses. The same applies to a downward strong trend.
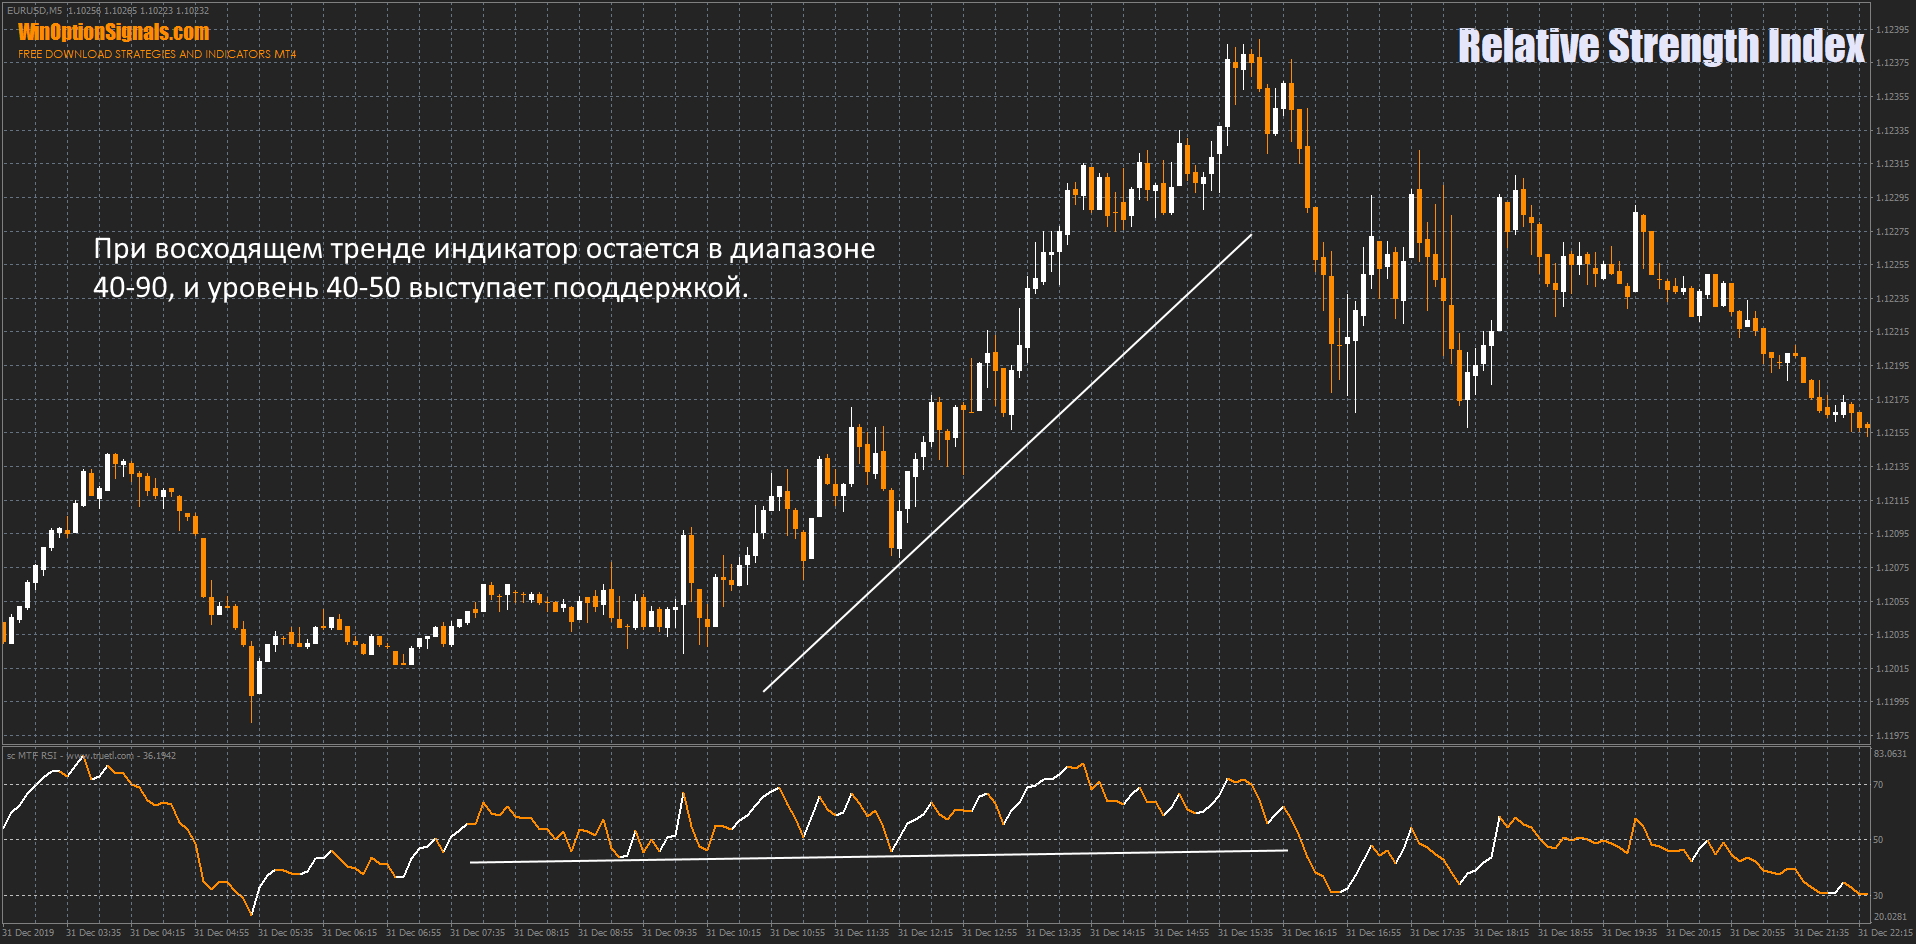
Trend identification using the Relative Strength Index indicator
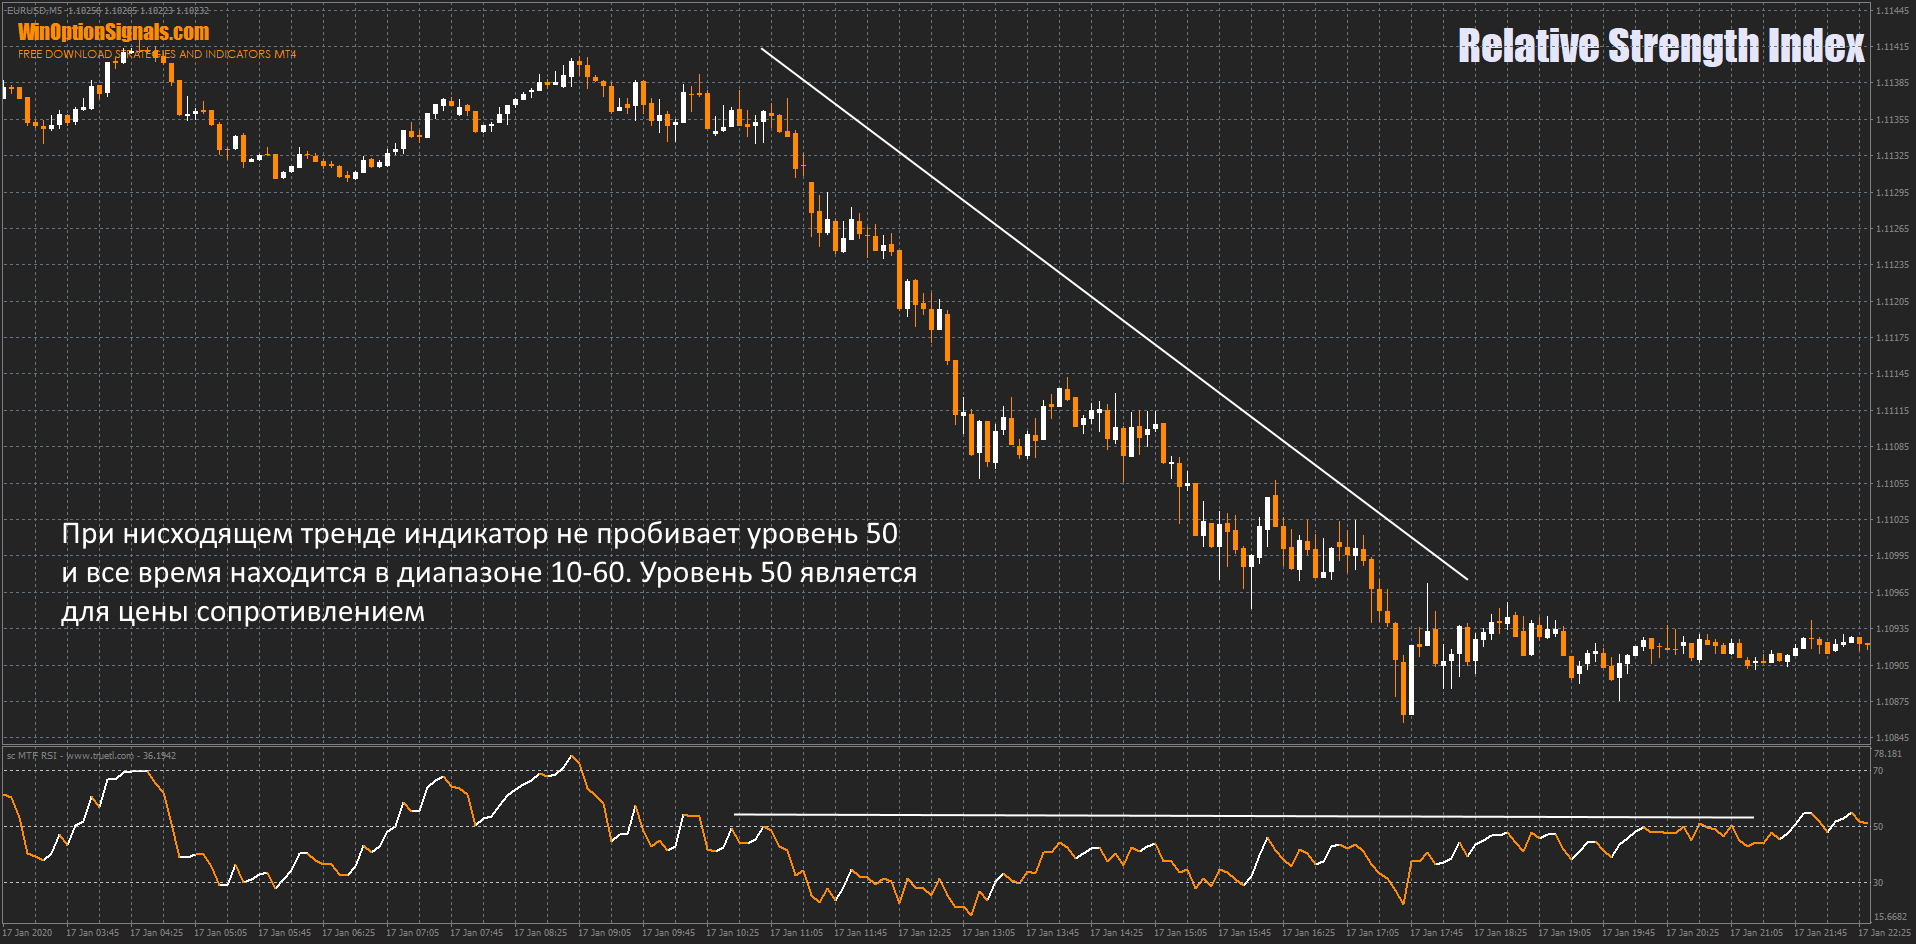
There is an assumption that the oscillator does not move between 0 and 100. The RSI tends to fluctuate between 40 and 90 in a bull market (uptrend) with levels of 40-50 acting as support. These ranges may vary depending on the RSI parameters, trend strength and volatility of the asset. And also RSI tends to fluctuate between 10 and 60 in a bear market (downtrend) with levels of 50-60 acting as resistance.
It is worth noting that this type of analysis using this indicator does not provide entry points, but only helps to make sure that a certain trend currently prevails in the market.
Uptrend
Downtrend
Conclusion
The Relative Strength Index indicator has continued to show good results for many years. One of the advantages of this indicator is that it is universal and can be used on any asset and time frame. In addition, it can be used to determine which trend is prevailing at the moment.
Do not forget that even if you select the necessary settings for the RSI indicator, you must test its operation on a demo account. If you don’t know which broker to choose for trading, then on our website you can familiarize yourself with the rating of binary options brokers .
Download template and indicator Relative Strength Index (RSI)
Can't figure out how this strategy or indicator works? Write about it in the comments to this article, and also subscribe to our YouTube channel WinOptionSignals , where we will definitely answer all your questions in the video.

See also:
Indicators for binary options trading
To leave a comment, you must register or log in to your account.