The Bollinger Bands indicator is one of the most popular indicators and is used by traders around the world, and it was developed in 1987 by investor and analyst John Bollinger. Since that time, this wonderful indicator has helped many traders make a fortune and is still widely used all over the world not only by exchange players, but also by participants in the binary options market.
The advantage of this indicator is that it is a standard indicator on almost all well-known and publicly available terminals and trading platforms and is suitable for trading cryptocurrencies , currency pairs , stocks and any other trading assets. Therefore, you can use it not only in MetaTrader 4 and 5, but also on a live chart for binary options .
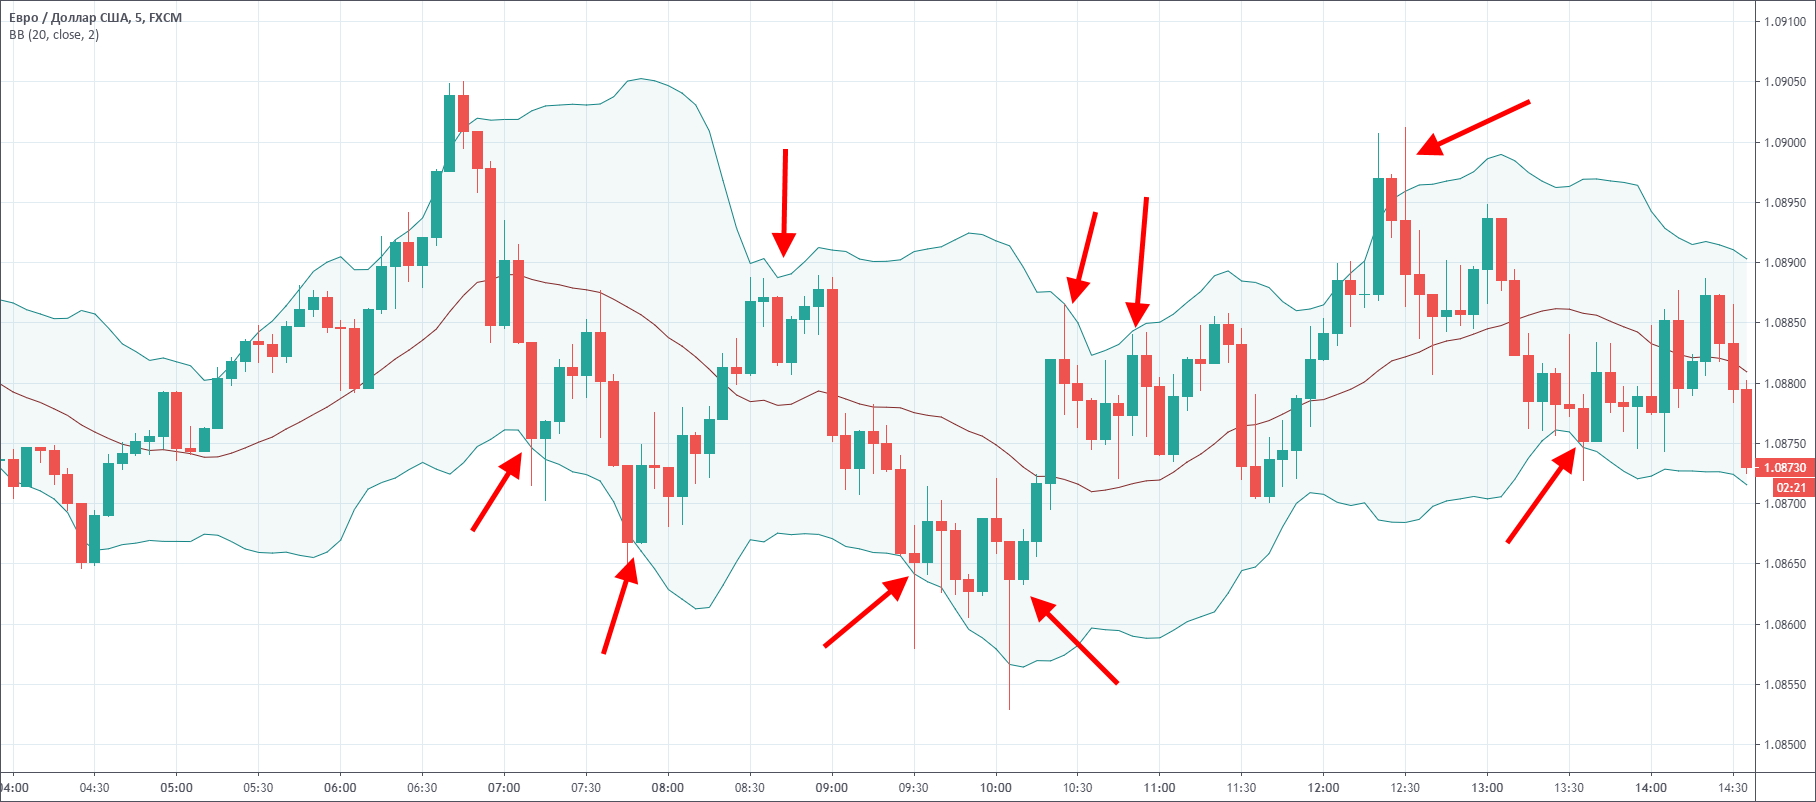
The indicator looks like this:
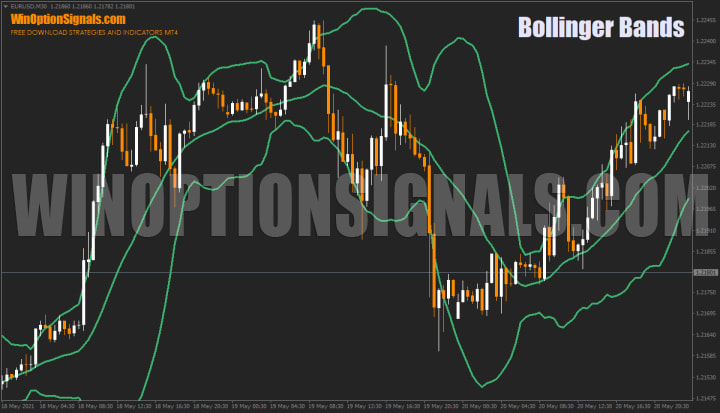
Description of the Bollinger Bands indicator for binary options
On the chart, as has already become clear, the indicator for binary options Bollinger Bands looks like two wavy lines that define the upper and lower boundaries of the price corridor. We can conditionally consider them as support and resistance levels . Most often they are located at a distant distance from current quotes.
Bollinger Bands (BB) are in many ways reminiscent of another indicator - the “envelope of moving averages” (Envelopes):
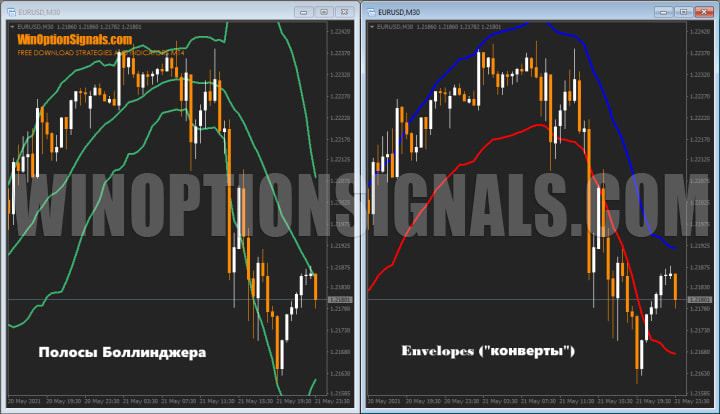
The difference is that the envelope lines are located on both sides of the Moving Average (MA) at a distance expressed as a percentage, and Bollinger Bands are at distances determined by the number of standard deviations, the value of which depends on the dynamics of quotes. Therefore, the BB width narrows in low volatility markets and widens in case of severe dynamic fluctuations.
The principle of calculating Bollinger bands: 5% of price movements should go beyond the boundaries of the lines, and 95% should remain within the corridor. There are three lines in the indicator tape. In the middle is the usual Moving Average. The upper limit of the corridor is determined by adding the standard deviation value to the MA (which is equal, for example, to “2”). The lower one is calculated in a similar way using the subtraction method.
The exclusivity of the channel formed by Bollinger Bands is manifested in the fact that its width changes depending on the stability of the market. The width of the stripes along the moving average is directly proportional to the average square deviation from it over the period under consideration. When the dynamics of price fluctuations intensify (for example, after the release of news affecting the global economy), the BB expands, but in a calm market, on the contrary, it becomes narrower.
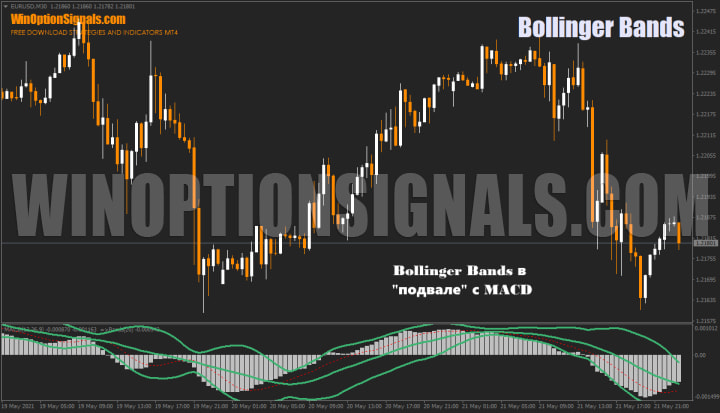
Regarding how to use Bollinger Bands in binary options, we recommend analyzing it in conjunction with the readings of other indicators. The value of BB is that it allows you to determine rapid deviations from the average quotes of the trend movement of an asset. If the indicator parameters are selected correctly, then the MA will become an excellent support or resistance level, and the extreme lines can be used as targets when opening orders. When trading binary options, Bollinger lines are usually placed on the price chart, but if desired, they can be combined with another indicator (for example, an oscillator) at the bottom of the interface in a separate window:
The Bollinger Bands indicator determines the minimum and maximum price values in development. If it is directed upward, then the quotes move until they are stopped by an oncoming serious force. The uncertainty sector appears below the upper or above the lower border.
The flat continues until the lines of the Bollinger Bands begin to diverge to the sides of the price candle, indicating that the resistance has ended. Quotes can dynamically move in the direction of the current upward/downward trend along the indicator border. At the same time, when using Bollinger Bands in binary options strategies, one should not forget that the final trend is affected by all support and resistance levels, and not just those indicated by the indicator.
Calculation of the Bollinger Bands indicator
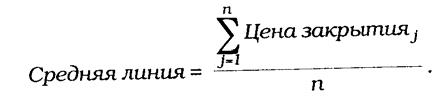
The Bollinger Bands indicator tape includes three lines. In the middle is the usual Moving Average. In the formula below, n is the number of time units (usually days) over which the moving average is calculated. Formula for calculating the center line:
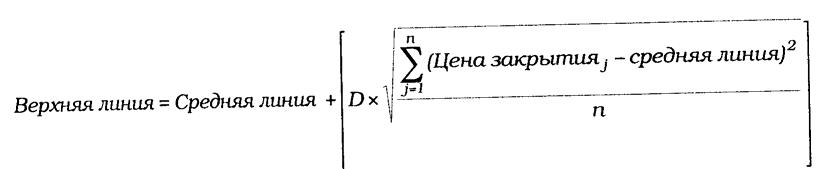
The top line is the MA shifted upward by a fixed number of standard deviations (for example, by “2”), which is denoted by the letter “D” in the formula below:
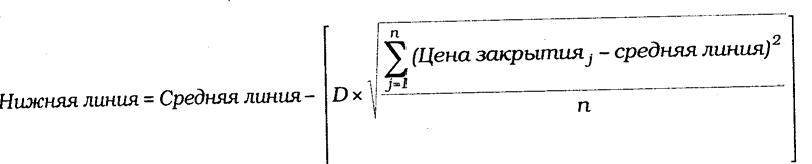
The bottom line is the Moving Line, shifted down by the same number of standard deviations (that is, by “D”):
The creator of the Bollinger Bands indicator himself advises using a 20-day simple Moving Average in the center, and calculating the outer lines based on “2” standard deviations. He also warns that readings of “moving averages” taken in less than 10 time units are uninformative.
Bollinger Bands indicator settings
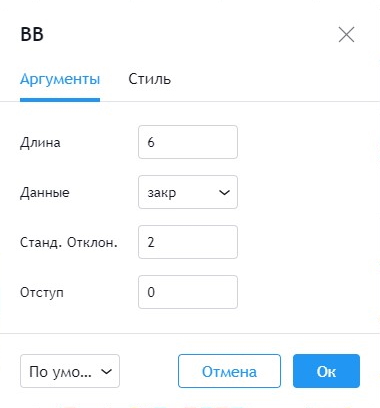
Based on the operating principles of the Bollinger Bands indicator, which we discussed above, you can select the deviation value in the settings:
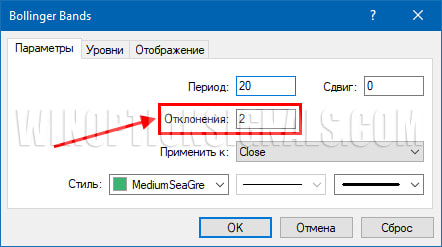
With default settings, the asset price will be in the channel 95% of the time. And accordingly, when the indicator lines begin to diverge, this indicates a trend, and narrowing, on the contrary, indicates a flat.
The indicator settings also contain the following parameters:
- Period. The recommended period for Bollinger Bands is “13-24” (the most popular is “20”), the deviation is “2-5” (the optimal is “2” or “3”). You can experiment with Fibonacci numbers and levels, the number of trading days (240) in a year, the calendar year (365), try round values from “50” to “200”. It should be borne in mind that the longer the time period, the lower the sensitivity of Bollinger Bands, and when working with binary options in a calm market, too long an interval will render the indicator useless. The vast majority of the time, quotes move within the price range, however, with a strong impulse, it is normal to move beyond the boundaries of the extreme lines. Moreover, if the graph very often goes beyond the boundaries of the tape, it is recommended to increase the time interval. If quotes almost never touch the boundary lines, then it is better to reduce the time interval;
- Shift. Simply moving the indicator forward or backward by a certain number of candles;
- Price (apply to) . Most often, closing prices are used to calculate the Bollinger Bands indicator. You can try other options, for example, typical or weighted quotes;
It is also worth remembering that in binary options strategies, Bollinger lines work equally well on any time frame , but they are most often used for short-term transactions during the day. We should not forget that the indicator must be configured separately for each asset and timeframe.
Advantages and disadvantages of Bollinger Bands
The advantages of Bollinger Bands in binary options strategies are determined by two very important points:
- The indicator shows the main trend lines and border ranges, similar to the moving average and price movement;
- The tape narrows/expands as quotes move. The combination of these properties allows you to create original patterns as Japanese candlesticks cross certain lines. For example, if a Doji candle , which signals market indecision, touches the converging lines of the indicator, this indicates a likely price reversal in the short term. Bollinger Bands respond to price dynamics with twists and turns. Its wavy movements suggest how far the momentum will go before the reverse force pushes the price towards the middle axis. There is a complex relationship between the direction and the expansion/constriction of the band depending on the price movement. To fully understand the mechanics of these interactions, you will need extensive practice using Bollinger Bands in binary options strategies. However, the days and weeks spent monitoring the indicator will not be in vain.

The main disadvantage of the Bollinger Bands indicator for binary options is the same thing that interferes with the simple moving average - it lags. The longer the time interval, the greater the lag.
By the way, if Bollinger Bands are placed on the chart when trading binary options, then you can remove the CCI oscillator without hesitation. It operates according to the same rules as BB, that is, it uses an offset relative to the Moving Average. However, the tape visually correlates better with price movements.
Trading strategies using the Bollinger Bands indicator
There are many strategies built on the basis of Bollinger Bands, but it makes no sense to use them all, since there are several effective and time-tested strategies:
- Rebounds and impulse breakouts of the boundaries of the Bollinger Bands indicator;
- Candlestick sequence with Bollinger Bands indicator;
- BB Stochastic System;
- SAR BB Envelopes System.
Also at the end of the article you can download the Envelopes indicator for MetaTrader 4. All other indicators that will be used in this article are standard and built into the terminal.
Rebounds and impulse breakouts of the Bollinger Bands indicator boundaries
The indicator is a channel indicator and therefore one of the most used types of signals is a rebound from the boundaries within the channel. This approach especially works during a flat and during the Asian trading session (night time). But since there are enough flats during the day, it is better to exclude night time and focus on liquid sessions:
As you can see, during a flat, almost every price approach to the channel border ends with a rebound. Of course, this does not always happen, but very often.
This strategy is mainly used when working with turbo options, when expiration does not exceed 1-2 candles and the time frame is no more than 3 minutes. To increase accuracy, you can use filters, but most indicators may not show anything, since the impulse most often lasts about one minute, after which you need to immediately open a deal.
You can also slightly improve the quality of signals by waiting not just for approaches to the borders, but for an impulse breakdown and closing above or below the border:
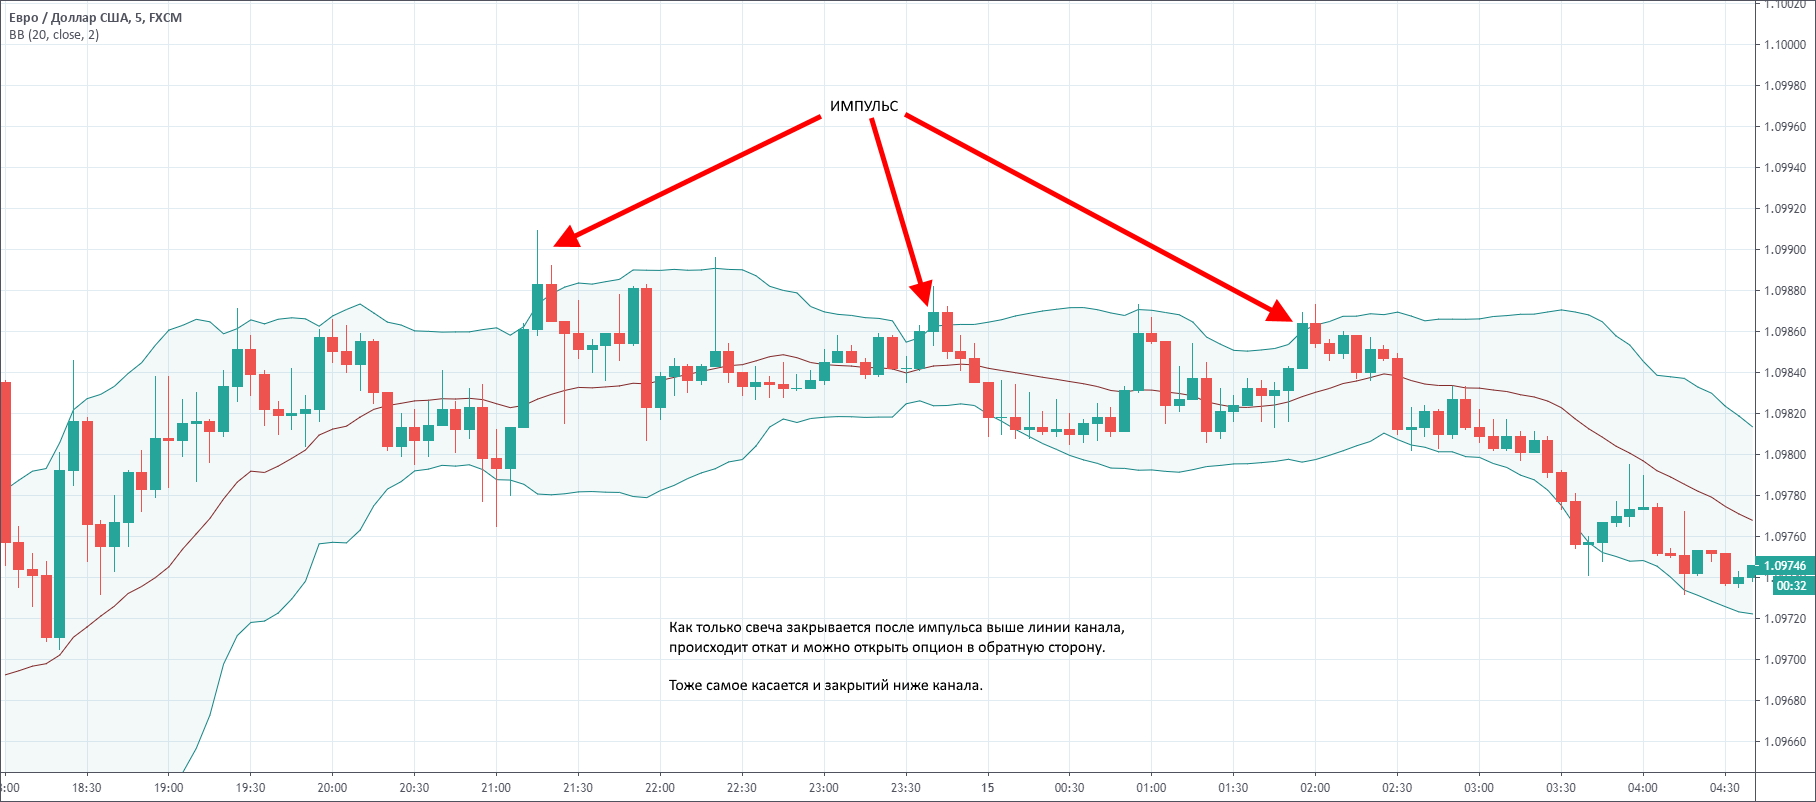
This approach will reduce the number of transactions and, when worked out, increase the quality.
Candlestick sequence with Bollinger Bands indicator
This strategy is the most inconvenient, as it requires collecting statistics for each asset that is planned to be used in trading. The bottom line is that a rollback occurs after a certain number of candles close above or below the channel border. If the indicators are 80% or higher, then such patterns can be used. For example, a sequence of 4 candles:
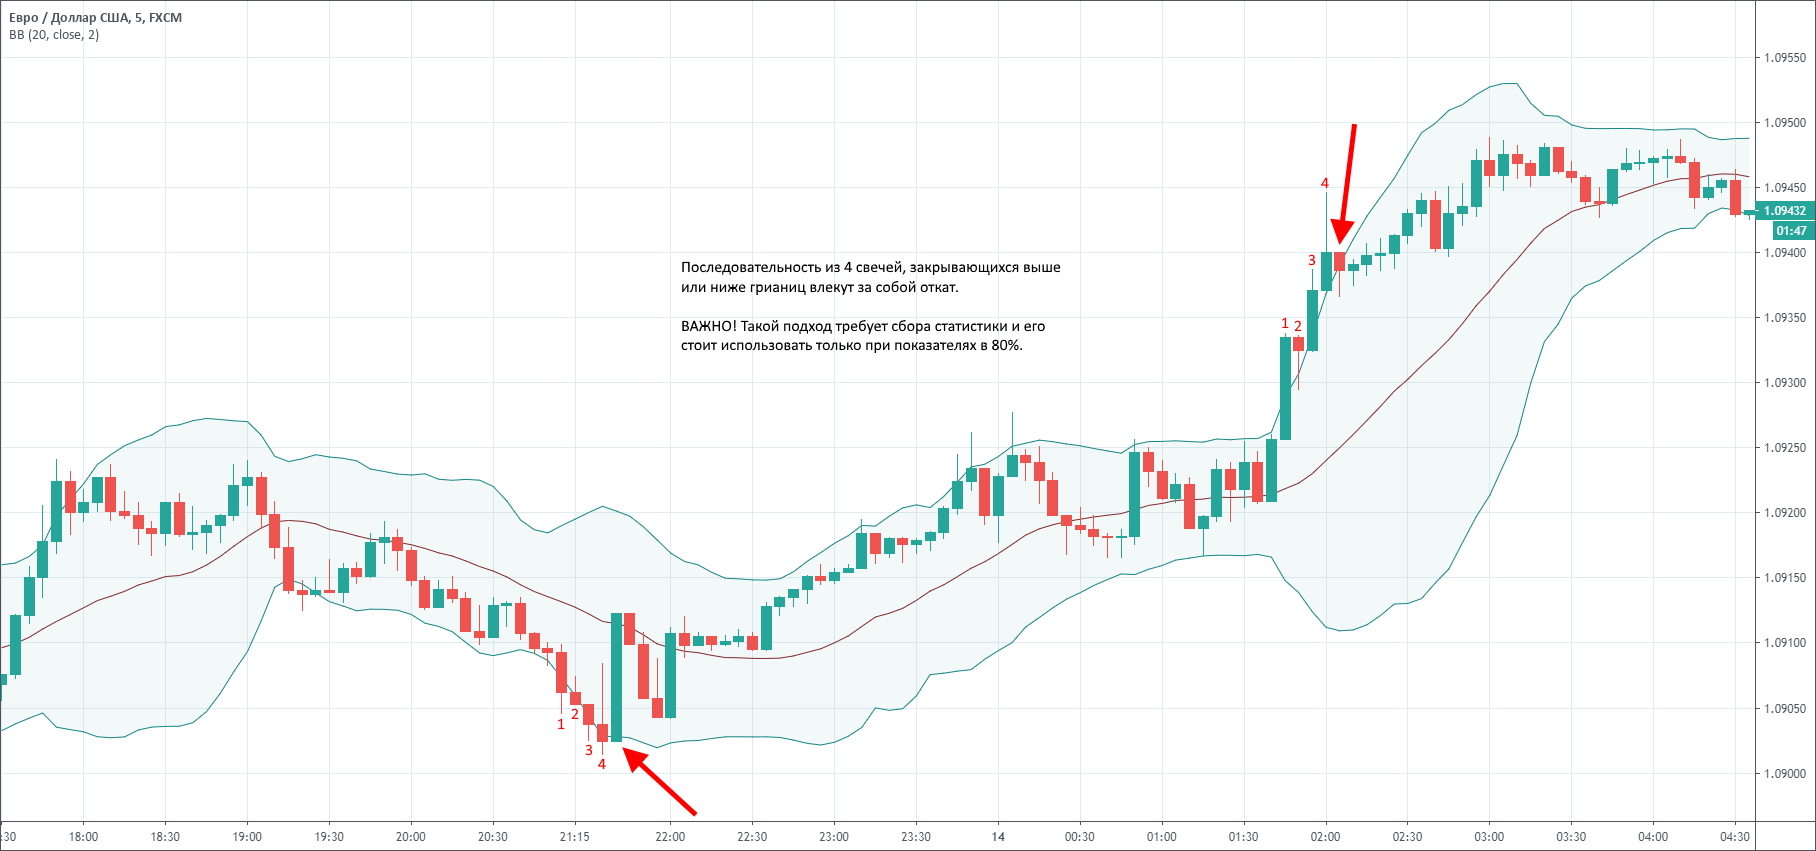
This example is figurative and you should not always use this number of candles, since there are no statistics on this pattern and the only option here is independent research.
BB Stochastic System
As one might guess from the name, in this case Bollinger Bands are used together with Stochastic, which in this case acts as a confirmation of breakouts or rebounds from the border in a flat.
In this case, when the price breaks out or approaches the channel border, it is necessary that the Stochastic be below the “20” level or above the “80” level:
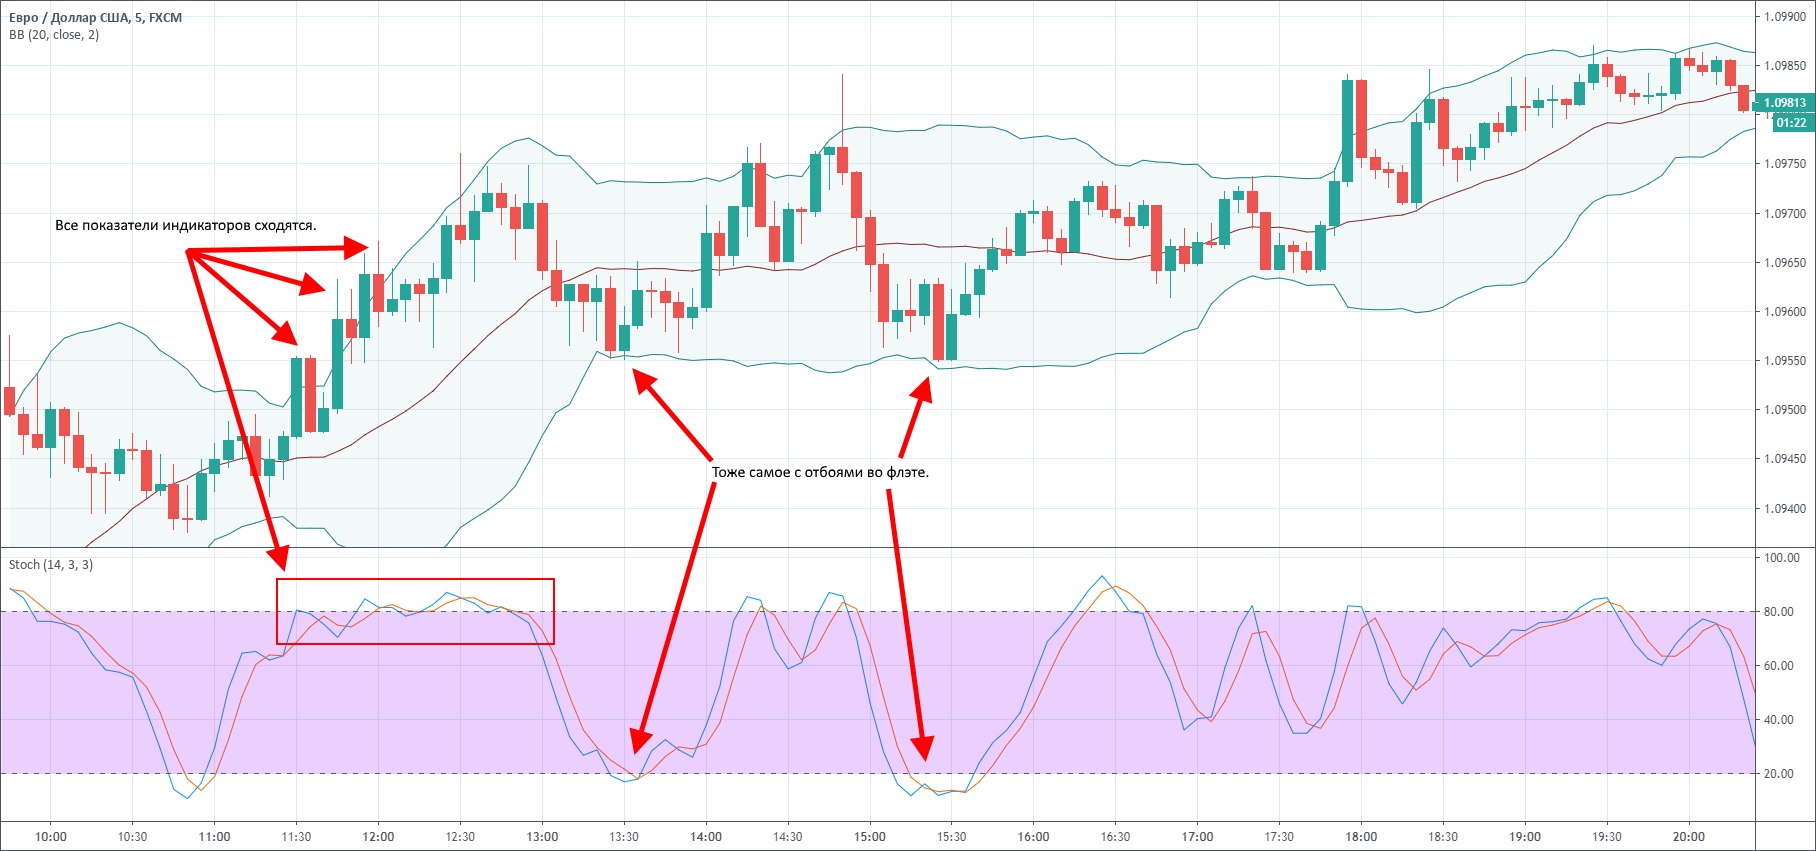
In this way, you can receive additional confirmation of signals both in a flat and in a trend. And if you select more precise settings for both indicators, you can further increase the quality of the signals.
SAR BB Envelopes System
This trading strategy was created for the Forex market and large time frames, but later it was adapted for binary options and expiration in 3 candles, regardless of the chart period. Therefore, you can use it on M1 charts, but the best option would be time frames as high as possible.
Its essence is to enter a position when a flat breaks out. The following indicators will help determine the breakdown:
- Bollinger Bands.
- Envelopes.
- Parabolic SAR
Non-standard indicator settings will be used:
| Bollinger Bands Settings | Parabolic SAR Settings | Envelopes Settings |
| | |
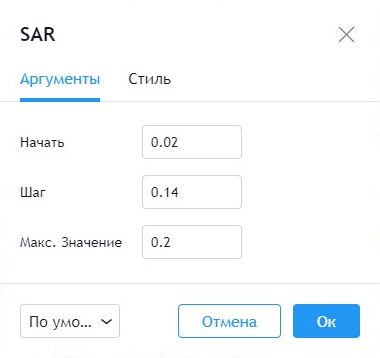
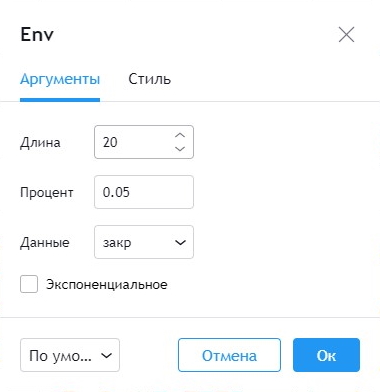
Now it all comes down to understanding that the market is in a narrow flat, which will be indicated by the Bollinger Bands indicator located in the range of the Envelopes indicator. Sooner or later the price will leave this range and immediately after the breakout you can open options. The parabolic should be higher or lower than the price, depending on which direction the breakout occurred:
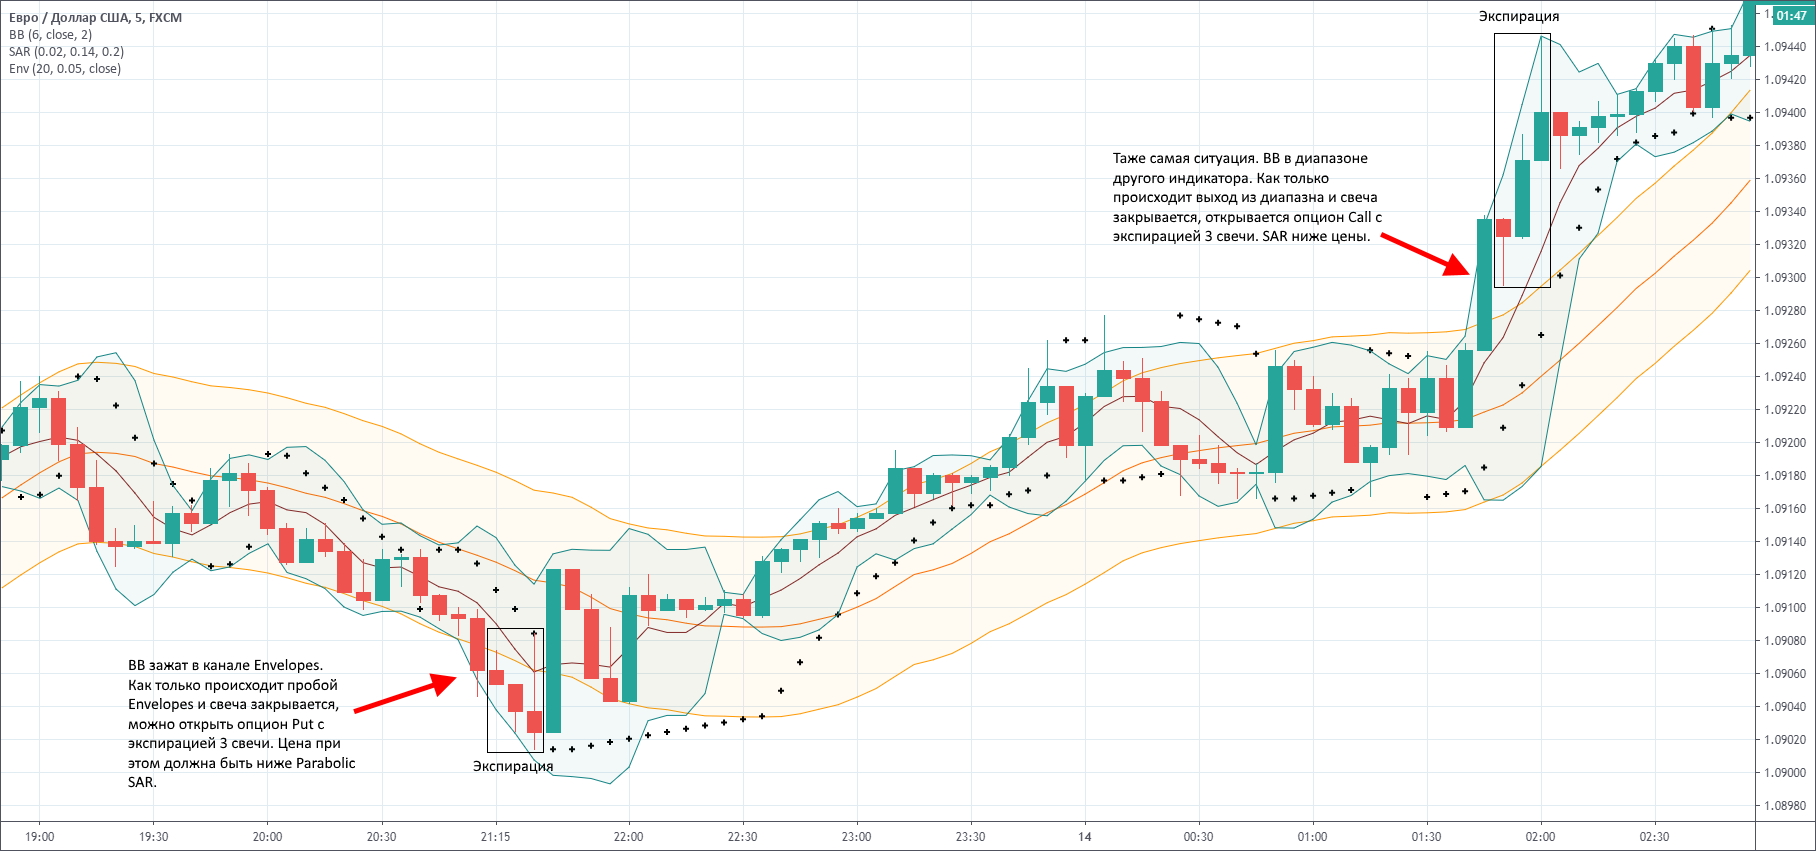
I would like to note that the best results with this strategy will be on time frames H1 and higher. Of course, it can be used for short periods, but in this case the risk increases, since the smaller the time frame, the higher the activity and the stronger the market noise.
Conclusion
You can find many more binary options strategies online based on the Bollinger Bands indicator, but all of them will be used in one way or another in a similar way.
Do not forget that strategy is not the only component of successful trading. An equally important role is played by following the rules of money management , as well as trading through a trusted broker. One of these can be found in our rating of binary options brokers .
Also, remember to always test all trading systems on a demo account to make sure they work.
Download the Envelopes indicator
Can't figure out how this strategy or indicator works? Write about it in the comments to this article, and also subscribe to our YouTube channel WinOptionSignals , where we will definitely answer all your questions in the video.

See also:
To leave a comment, you must register or log in to your account.