Oscillatory analysis of cryptocurrencies
Cryptocurrencies provided by tradingview
Analysis of cryptocurrencies using trend indicators
Cryptocurrencies provided by tradingview
Cryptocurrency market: technical analysis
Cryptocurrencies are distinguished by the fact that their value is growing at an accelerated pace. Bitcoin is especially active in this regard. His periodic ups and downs are simply amazing. As a result, the market is constantly filled with new players. Trading on cryptocurrency exchanges takes place in hyperactive modes. The high volatility of electronic money allows traders with relevant competence to make good money. This is possible, but on the condition that luck or the so-called intuition fades into the background.

An inexperienced trader can easily lose a lot if he cannot adequately assess the situation. You need to understand the direction of trends and be able to analyze promising cryptocurrencies selected for purchase or sale. It is better if the necessary information is received before you actually encounter exchange trading. There are many analysis methods, so you just need to choose the best one.
Let's consider a popular analysis of cryptocurrencies, characterized as technical. Some people are satisfied with it, while others see many shortcomings in it. At the same time, its effectiveness has been confirmed, so there are more of the former than the latter. Other types of analysis are of little use in the cryptocurrency market, which is characterized by high volatility and a large volume of news.
If a trader uses a method that takes into account news for analysis, then in relation to cryptocurrencies he does not receive any advantages. Changes in the market occur very quickly, and news about this is announced by the media very late. The situation is different with technical analysis, which makes it possible to more sensitively monitor the situation, which leads to the correct response to price changes.
Dow theory
Each method by which the behavior of electronic money is studied has a basis. It is based on concepts that determine the implementation of the task, for example, making a cryptocurrency forecast for 2018 with a greater probability of fulfillment. Let's consider technical analysis based on the Dow theory.
The concepts in this case are as follows:
- There are no factors that the market ignores. Events of any period of time affect the value of the asset at the current moment. Demand over time (yesterday, today, tomorrow) determines the price of a cryptocurrency. Changing regulatory rules regarding electronic money are reflected in the value of assets.
The price now is information whose existence is determined by the current moment. This includes the awareness and expectations of everyone operating in the cryptocurrency market. To analyze the future price, you need to analyze the value established today.
- Price changes occur with a certain pattern . Short-term and long-term trends influence the dynamics of asset prices. After a trend has formed, we can say with a greater degree of confidence that the movement will continue in the chosen direction. This is what traders are trying to capture. They make cryptocurrency forecasts based on technical analysis aimed at recognizing emerging trends.
- It is important to change the price from the point of view of the historical aspect, not the content. Through technical analysis, it is determined how the price has changed. The parameters influencing this change are of little interest. The trader takes more into account the dynamics of supply and demand.
- History is a spiral, that is, it repeats itself, which also applies to the cryptocurrency market. Traders' reactions to certain events are usually the same. The market is quite predictable. As an example, consider the news regarding the recognition of electronic money in any country. Such information inevitably leads to an increase in the value of assets.
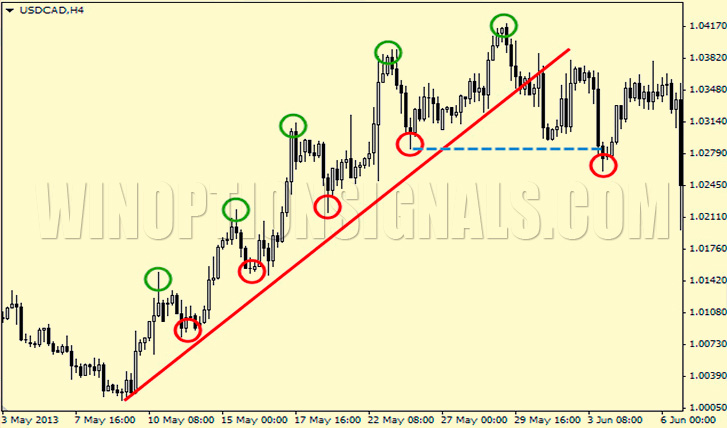
Identifying trends
Trends mean where the price of an asset is moving. However, it is quite difficult to recognize this kind of dynamics. Cryptocurrencies are characterized by high volatility, which is characterized by sudden changes in exchange rate. This is demonstrated by the same Bitcoin.
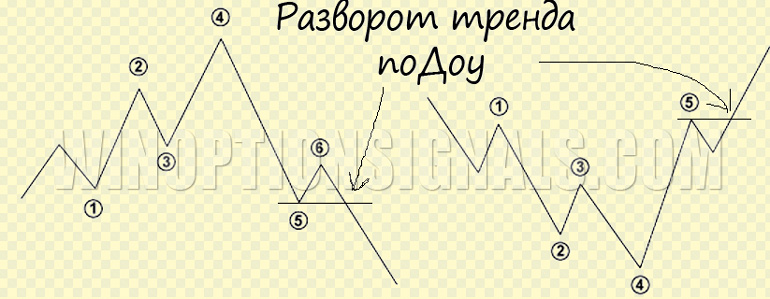
Volatility spikes are not something that should be taken seriously in technical analysis. Rising highs and lows indicate an increasing trend. This statement is also true in reverse. A decrease in highs and lows confirms the onset of a downward trend. If the exchange rate is stable, that is, its noticeable change is not recorded, the trend is defined as sideways. All mentioned trends have different durations.
Balancing the forces of supply and demand
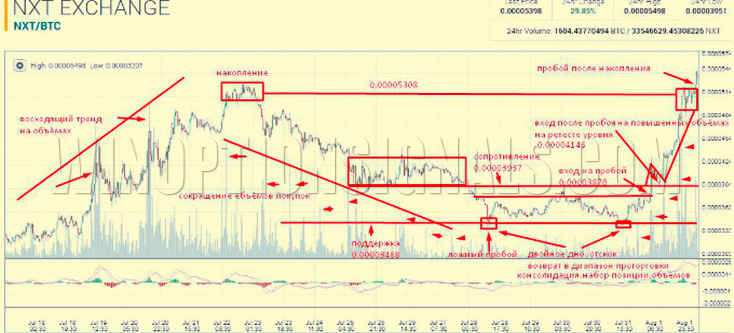
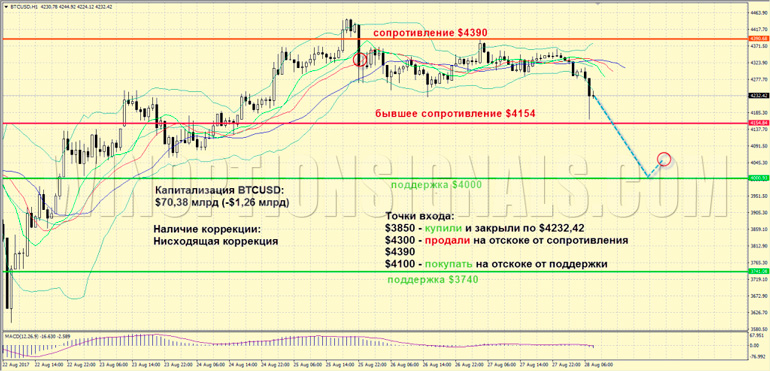
Raising the price to a certain level leads to a decrease in interest in purchasing. The maximum is reached. Buyers are losing activity and sellers are gaining. After which the price begins to move down. In the same way, everything happens in the opposite direction. In the first case we can talk about resistance, and in the second – about support. When supply increases, a downward trend occurs. While the increase in demand forms a growing trend.
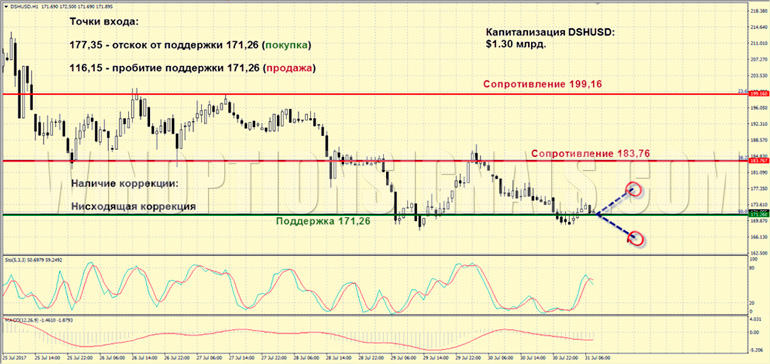
On the chart, you can draw lines connecting price peaks, both positive and negative, differing in approximately the same values. These are levels characterized by support or resistance. It is necessary to identify them through technical analysis. Specific levels determine the prospects for cryptocurrencies , which leads to the issuance of buy or sell orders. As a result, the value of assets is adjusted. A competent analysis of such moments allows you to successfully respond to exchange rate fluctuations in the short term.
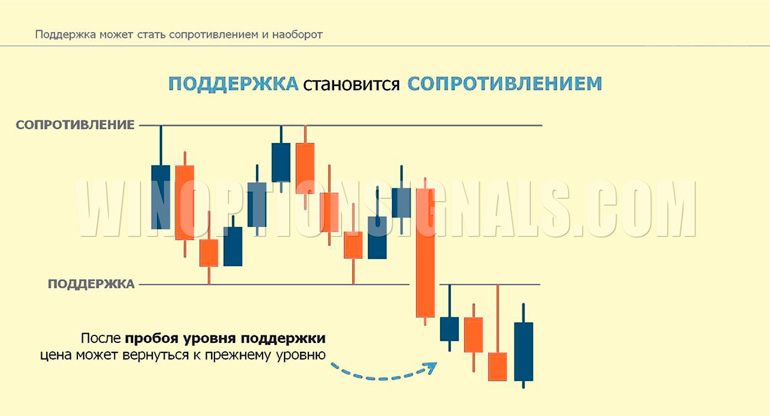
Support level is the value of an asset that suits most traders. They are ready to buy. There is only one justification here - the real cost is higher than the declared one. Achieving this level greatly increases the number of buyers of assets on the exchange. The low price attracts, which stimulates demand. Let's consider a conditional altcoin. Let's say it cost $500 for a while, then went up and reached $800, where it stopped for a relatively long time. What will happen if the price periodically returns to $500? Of course, players will flock to exchanges to buy this currency.
Resistance level – the value of the asset is overvalued, which forces traders to start dumping the currency. A similar situation arises as with the support level, but with a minus sign. The currency was stable in terms of price. Then its value dropped to a certain point, where it froze for a long time. A return to the previous value will force most traders to start placing sell orders.
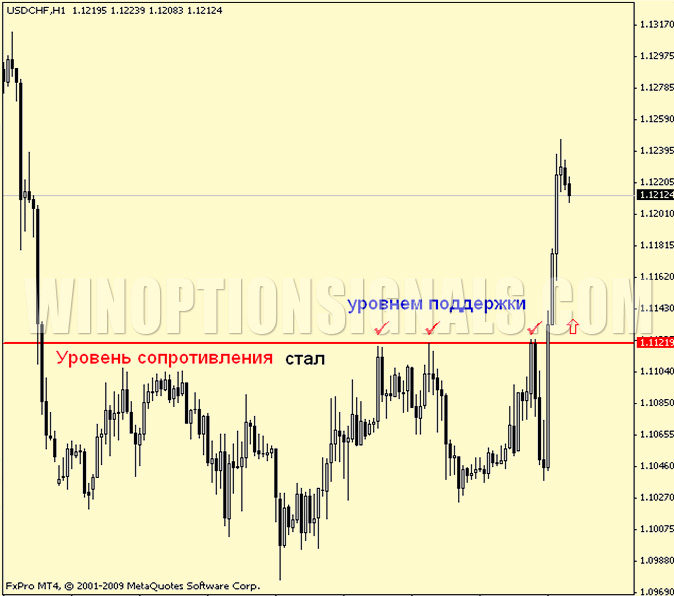
Changes in the value of assets are sensitive to the market. Using support and resistance levels, a kind of price channel is created. Successful traders actively use it. They understand that reaching the bottom requires buying currency, and reaching the top requires selling.
In the case when the price breaks through the price channel, that is, existing levels are overcome, it collapses. For example, the price of an altcoin rises above a resistance level. If this happens, then this level becomes the support level of the newly formed corridor. The same situation, but on the contrary, looks like this: the price tends to go down and overcomes the support level, which turns it into the resistance level of another channel.
Graphical models of technical analysis
Price volatility creates a chart in the form of a picture. Regular return to certain levels draws figures, as it were. They are similar to each other and are constantly repeated. In this regard, it becomes possible to make predictions about where the price will go based on graphic models.
Let's look at the most common of them:
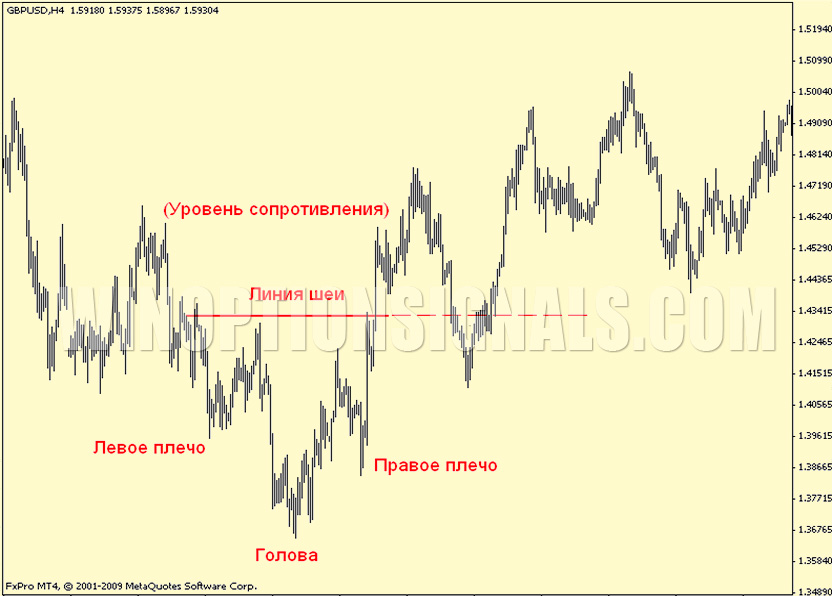
- Head and shoulders . The formation of this figure occurs as a result of a stable trend of sufficient duration. Visually, these are three consecutive peaks, where the middle one forms a kind of head, and the two on the sides form the shoulders. There is a direct figure - the peaks point upward and a reverse figure, characterized by a minimum rate. With the help of such figures , analysis of cryptocurrencies , defined as technical, is available. Recognizing the patterns formed on the chart allows you to make a forecast regarding the expected price movement.
- Double top (bottom). A pattern with two tops that is created after an uptrend. Double bottom – downward trend. These figures are identical in relation to each other. The only difference is that they are opposites. This chart display is used in technical analysis as a signal about an upcoming change in trend direction.
- Rectangle. A figure demonstrating the rivalry between buyers and sellers. Such opposition leads to stagnation in the trend. Both sides have equal chances of making a profit. Those who buy and those who sell can count on success. It is important to pay attention to exactly how the price changes. If it moves in accordance with one of the horizontal sides of the rectangle, then the figure works. Otherwise, the chances of success tend to zero.
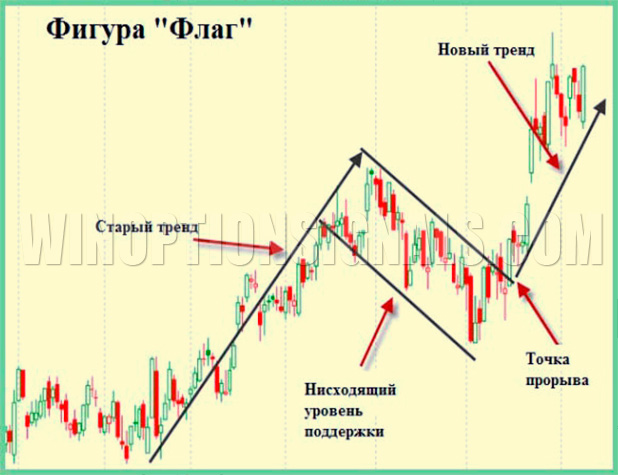
- Flag and pennant. A graphical model of this type appears after a sharp movement in the value of an asset in any direction (up or down). It is created during the pause of such a jump. The formation of such figures serves as a signal that we should expect a sharp change in the value of the cryptocurrency in the near future.
- Japanese candles. Candlestick figures appeared on the Japanese stock exchange. This happened in the seventeenth century. That's why they are called Japanese candles. The body of the candle is a distance that starts at the opening price point and finishes at the closing price point. At the same time, shadows of the candle are still formed, extending from the opening and closing prices to the peak price values. An increase in the upper shadow serves as a signal that the value of the asset is expected to increase. The lower shadow indicates a fall in the exchange rate. This method divides time into periods, which greatly simplifies tracking trends.
Technical indicators
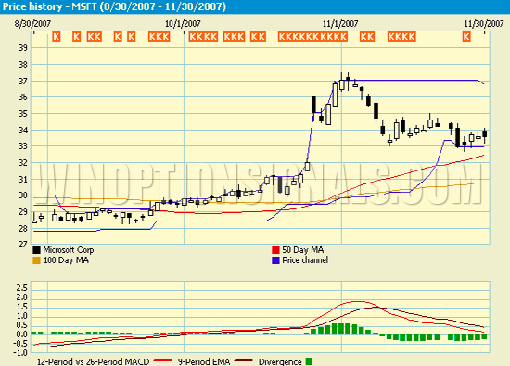
Moving averages serve as an indicator that helps track the rate during high volatility. To calculate a moving average, defined as a simple one, the average value of the asset price for a particular period is taken. Cryptocurrency analytics are available here based on technical analysis of several moving averages depending on a specific period of time, which is important when indicators are unable to respond in time. Consider a situation where the 5-day moving average falls below the 20-day. If this is the case, then you should count on the bearish mood of traders. Otherwise, when the 5-day line exceeds the 20-day line, bullish sentiment is expected.
Moving averages are not the only indicator. There are others. But the considered method of implementing technical analysis is more popular. It is well received by techies as it has a mathematical basis that makes it possible to accurately track the market. There are also no complaints from humanities scholars. The analysis process is easy without difficulties of understanding, putting prudence rather than luck at the forefront.
Trading volumes
If you take a look at cryptocurrencies , you will see that electronic money is selling very well. The size of trading volumes affects the formation of price trends. An increase in sales leads to their strengthening, and a decrease leads to a weakening. When a cryptocurrency rapidly rises or begins to lose its positions just as actively, this serves as a signal to pay attention to trading volume.
If the value of an asset rises for a long time and then falls, then trading volumes can help determine the characteristics of this dynamics. It's easy to understand what's going on. A prolonged fall or just an adjustment. Basically, an increase in price leads to an increase in trade volumes. Otherwise, when the price rises but the volume does not, we can say that this trend will not last long.
Different perceptions of technical analysis
Through technical analysis, the cryptocurrency market can be effectively researched to help identify trends. Some support this approach, while others oppose it.
Quite a lot of traders are confident that information about an asset is reflected in its price. If you adhere to this judgment, there is no need for technical analysis. This perception of stock trading has a right to exist, but it lacks flexibility, which causes a lot of criticism.
Another part of traders builds their trading strategy taking into account world news regarding cryptocurrencies. If information of this type is positive, then buy orders are issued, and if negative, sell orders are issued. This method of trading can be justified only in the long term. It has shortcomings and there are many of them. At a short distance it is minimally effective.
Conclusion
Researching the cryptocurrency market from the perspective of technical analysis currently looks like a promising direction in trading. This is the most effective tool at short distances. If you are interested in such speculation, then use it. Although we should not forget about other methods. Try to connect them together. Take an integrated approach. Refer to the fundamental method, read articles from experts and follow news on cryptocurrencies. This way, you can always keep the market situation under control, which will allow you to accurately identify successful moments.
To leave a comment, you must register or log in to your account.