
Traders often look for a live chart for binary options and the full version of this live chart from TradingView is available for free on our website. You can learn in detail about all the functionality of the full version of the live chart for binary options from TradingView, where you can use not only indicators , but also strategies , signals, traders’ chat, trading ideas, and also fully customize everything to your taste:
What is a live chart for binary options
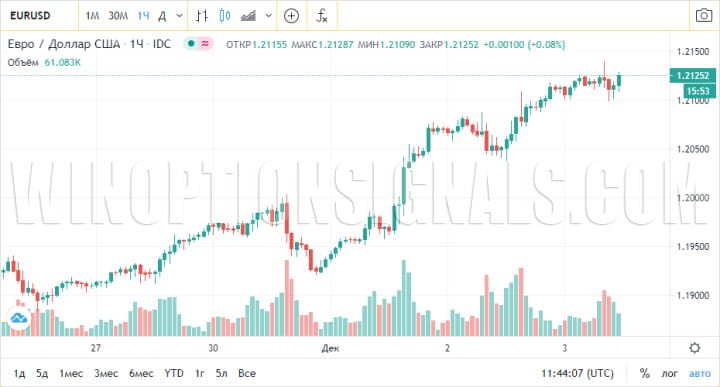
To trade binary options , you can use the MetaTrader 4 platform , but there is an equally convenient option - a live chart (live chart, chart online) of binary options online from TradingView. It can be opened directly in the browser, and it is called a live chart because quotes are updated instantly and all prices are broadcast in real time. Some brokers, due to signal providers, have delays in displaying prices, albeit subtle ones; the live binary options chart does not allow this, all data is displayed as quickly as possible.
Live charts of binary options will be useful not only for beginners, but also for professionals, since they can be used in absolutely different cases, and this can be either an analysis of the current situation or simply observation of other trading assets, which can be found in a live chart. a bunch of. Also, when using a live chart online, you can view any timeframes , use indicators and study the history of quotes:
How to Use a Live Chart: Guide and Tips
Most likely, many traders are familiar with the TradingView platform . It is thanks to this trading platform that it becomes possible to use binary options charts online and trade from the live TradingView chart.
Over the long period of time this company has been operating, the platform has only improved and therefore live binary options charts work without delays or lags, and that is why many reputable resources, including the Chicago Mercantile Exchange (CME) itself, use these charts on their websites and services.
What you can use when studying live charts online:
- All trading assets that are traded on world exchanges;
- A large number of chart types;
- Timeframes;
- Indicators;
- Asset correlations;
- Graphical tools that give a head start to many professional terminals.
Next, let's look at each of the functions in more detail.
Trading assets on a live chart
Traders can rest assured that the list of available assets available in live options charts in real time is quite impressive. With many brokers you can trade not only standard currency pairs like USD/RUB, but also various “exotic” instruments. The developers of the live online binary options chart strive to satisfy the needs of all traders, so you can easily find in it even less popular currency pairs like USD/ZAR, USD/SGD and, of course, cryptocurrencies .
In order to find the required asset, in the upper window we remove the inscription USD/RUB and enter the name we need. For example, you can find and view a live chart online for the AUD/USD currency pair. To do this, we “drive in” the name of this pair in the window and get a list of different assets, including the AUD/USD pair itself and other currency pairs (cross rates):
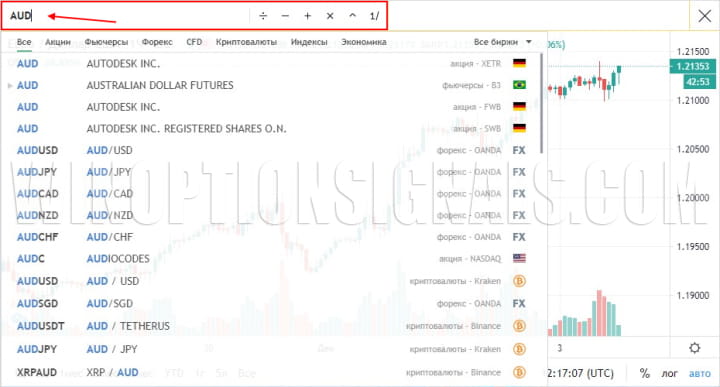
Also convenient when using the search are tips that offer various options. To get hints, just start typing the first letters.
Live chart type
The real-time binary options chart allows you to select any type of chart by clicking on the “arrow” on the panel next to the asset name, after which the entire list will open:
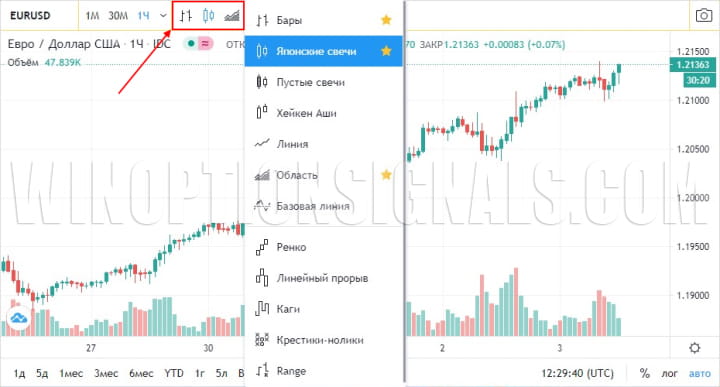
A total of twelve types of charts are offered:
- Bars (Bars or Columns). This type of chart display is less common than candlesticks, but some traders prefer it due to the information content and brevity of price display;
- Candles (Japanese candles). It is the most popular type of quote display and is used by traders around the world. The peculiarity of candlesticks is that it is not only a type of price display, but also a ready-made trading strategy that has two branches: Price Action and candlestick analysis of binary options ;
- Hollow Candles. Their only difference from classic candles is that the “bullish” candle has a green outline, but is colored white for greater clarity, and the “bearish” candle is completely red;
- Heiken Ashi (Heiken Ashi). A Heiken Ashi candlestick chart is similar to regular Japanese candlesticks, however the calculations for constructing them are completely different and the algorithm is based on information from the previous candlestick. This type of chart can be used for different types of trading, including short-term;
- Line. The line chart perfectly shows the main trend, but it is inconvenient to work with it when concluding transactions, since it works based on closing prices and does not show the shadows of candles or bars;
- Area. Modification of a line graph with a colored lower part to clearly demonstrate the trend;
- Baseline . A mixture of a line chart and an area that divides the chart into two equal parts and the upper part is colored green (bullish) and the lower part is colored red (bearish);
- Renko (Renko). This type of chart is also called “brick”, since its candlesticks are always rectangular in shape. Suitable for well-trained professionals. This type of chart clearly displays the main trend and corrections in the market, but it should not be used separately from other approaches. It's important to note that this type of chart is not time-based;
- Line B reak (Linear breakthrough) . This type of chart is also not tied to time and looks like candles without shadows. The construction is based on a comparison of the closing prices of the current and previous bars.
- Kagi (Kaga). Such a chart is built according to an initially defined time and any intervals can be used (minute, hour, day, week), and the calculation of the amount of growth or decline is set in points or percentages;
- Point and Figure ( Tic Tac Toe ). This type of schedule is not tied to time and depends on the number of points that also need to be set initially.
- Range . Range charts are built according to the principle of a given number of points, as in previous cases, but there are no complex algorithms here. For example, you can set a 5R (Range) chart and bars will be formed only when the price moves 5 points in any direction.
It is worth noting that types of charts from 8 to 12 should not be used by beginners, since understanding and analyzing them is most often much more difficult than classic charts and they are suitable only for specific (and not for any) strategies or methods of analysis.
Timeframes on the chart
By choosing a specific time period of a live binary options chart, we determine the interval during which one candle or bar will be formed. To specify the required timeframe, you need to click on the “arrow” of the timeframe panel and select the desired one from the list that opens:
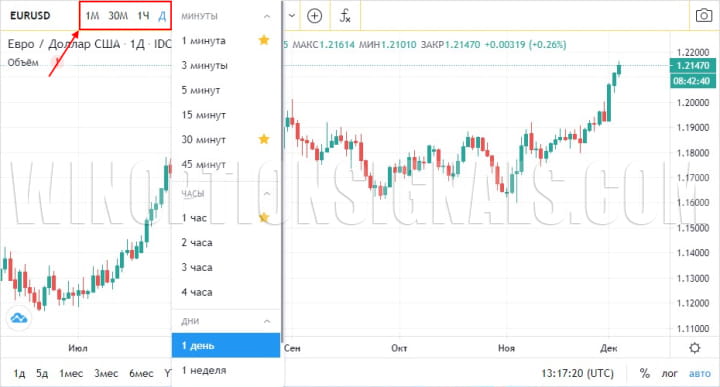
The big advantage of the real binary options chart is the list of time periods, which is optimal for analyzing binary options charts. When trading from a live chart, you can use timeframes of 3 or 45 minutes, as well as 2 or 3 hours, which are not available in MT4. This will be especially convenient in cases where the rules of the strategy imply the use of not a specific expiration time , but the number of candles.
Also note that by adding a time period to your “favorites” (by clicking on the “star”), it appears on the panel itself and you can quickly select it directly from there without having to open the entire list.
Set of indicators
The live binary options chart has a large number of indicators that are useful to the trader for trading. The main thing to remember is that none of them is the “Grail” for binary options that predicts future prices with 100% accuracy.
Some indicators well reflect the main trends, which may continue in the future. They demonstrate well and allow you to trade with the trend , for example, Bollinger Bands and Moving Averages , as well as various oscillators:
- Stochastic Oscillator ;
- RSI ;
- MACD .
You can add indicators to a live chart by clicking on the icon with the “formula” symbol:
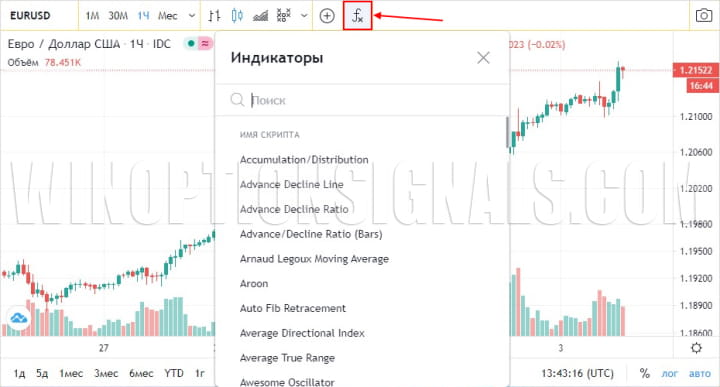
Then select the required indicator in the list that opens or use the search bar.
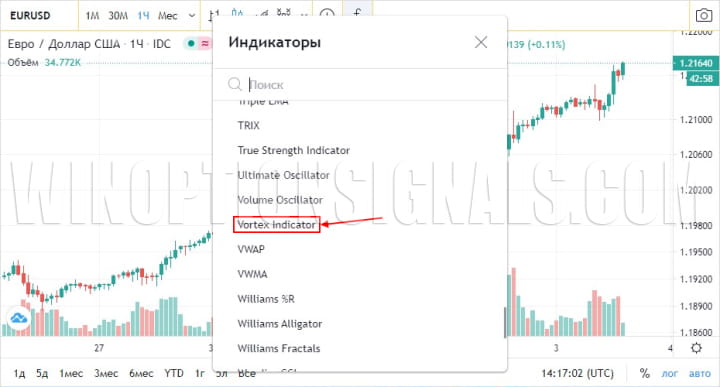
Please note that online binary options charts contain many more indicators than any of the standard terminals. For example, you can add an oscillator such as Vortex to a live chart online:
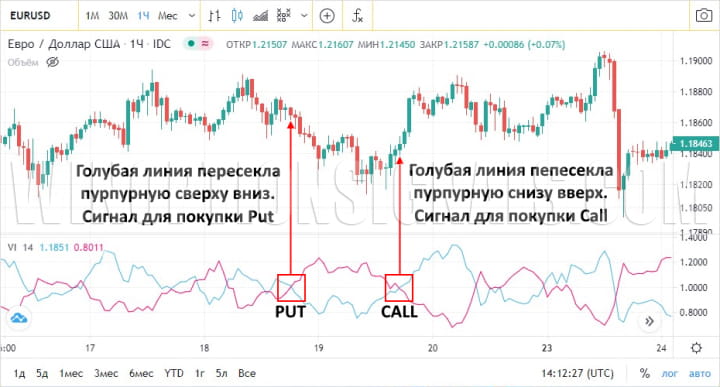
As a result, an indicator will appear on the chart, the trading rules for which are reduced to the intersection of lines, and if the blue line crosses the purple line from top to bottom, then the Call option is bought, and when the blue line crosses the purple line from bottom to top, the Put option is bought:
Also, if you wish, you can try other indicators on a live binary options chart online, and in particular you can pay attention to the modified standard indicators:
- One type of Moving Average is the Hala Moving Average (HMA). You can trade options using this indicator, just like using regular moving averages (for example, when the price crosses the indicator line), but this indicator is “softer” and therefore shows corrections and reversals more accurately;
- Other types of Bollinger Bands (Bollinger Bands %B, Bollinger Bands Width). The trading rules also do not change and you can buy options from the borders or when the middle line is broken, but on the modified Bollinger indicators the readings are more accurate thanks to new algorithms;
- Stochastic RSI . A mixture of two popular oscillators, trading on which is carried out from overbought and oversold zones or divergences.
Comparison of graphs
Using a real binary options chart, you can also see the correlation between any assets. To do this, click on the “+” icon and then find the desired asset in the search:
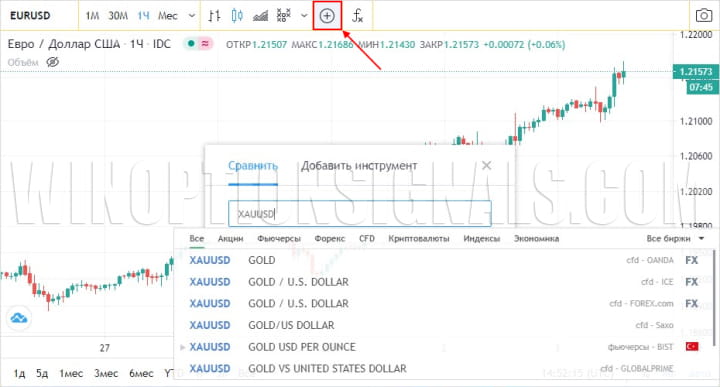
For example, you can compare EUR/USD, gold and oil:
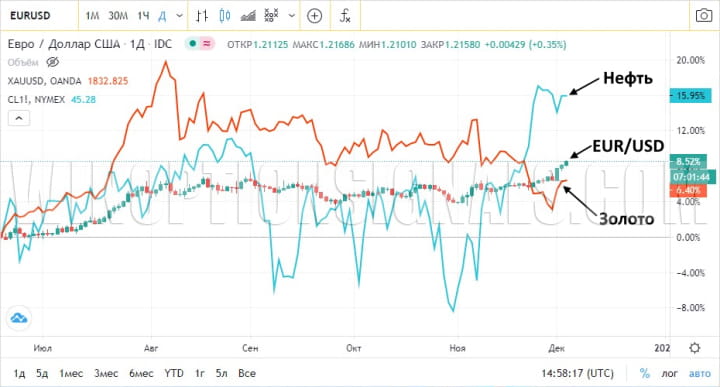
This way you can find assets that are correlated or not correlated with each other.
Correlation indicators can be used in different ways, but more often they are used as the basis for investment or guide trading strategies, since there is often a primary asset that leads the market, and secondary assets that can often follow the primary one. An example of such assets is Bitcoin , as the main cryptocurrency and the altcoins that often follow it.
Graphical tools
The panel on the left has many useful tools with which a trader can tailor real-time live options charts to his needs:
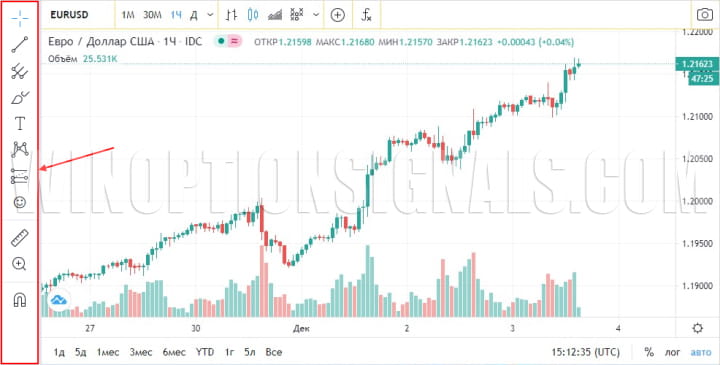
The Live Chart Toolbar includes:
- Trend lines (any type). They help to visually see the direction of the trend, as well as mark support and resistance levels;
- Graphic shapes - squares, rectangles, circles. Using these figures, you can highlight individual price zones or mark out graphic patterns;
- Lots of icons for notes (letters, arrows, emoticons). A set of symbols allows you to mark important areas of the price or sign them so that this moment is visible all the time;
- Gann tools (fan, grid). Exotic instruments that will be of interest to fans of Gann theory;
- Fibonacci tools (grids, circles, spirals, periods). For fans of Fibonacci tools, these figures will be extremely useful, as they allow you to find new price levels in addition to the standard ones;
- Tools for counting points and time. Tools that are ideal for counting the number of bars or time. There is also a tool for calculating risk, and for fans of Forex trading, they can calculate the optimal stop-loss and take-profit.
Removing all unnecessary details that you have superimposed on a live binary options chart is simple: reload the page, use an eraser or a button with a wrench and a brush on it.
It is worth remembering that too many additional elements will visually overload a live chart for binary options and it will be easy to get confused in them. Use only the most basic and what really helps you analyze the market.
Live chart: useful tips and tricks
The live binary options chart also has some useful features that may not be useful to everyone, but they are still worth knowing about. These functions include:
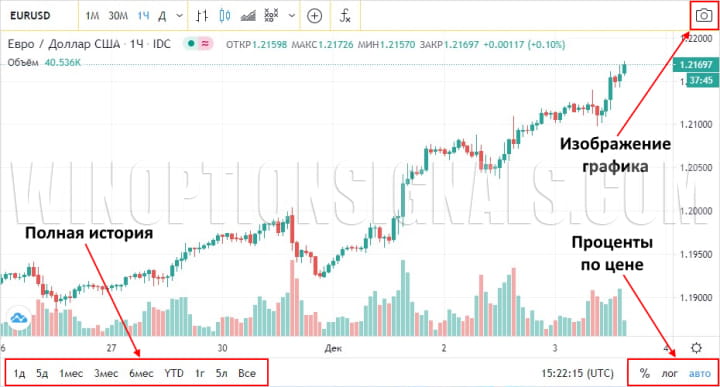
- Graphics images. If you need to take a screenshot, then it is not necessary to do it in a separate program, and you can use the standard functionality of the live chart;
- Price scale in percentages. The price scale can be displayed not only in numbers, but also in percentages;
- History of the chart. You can see the entire history of an asset on the chart using the buttons on a special panel at the bottom of the chart.
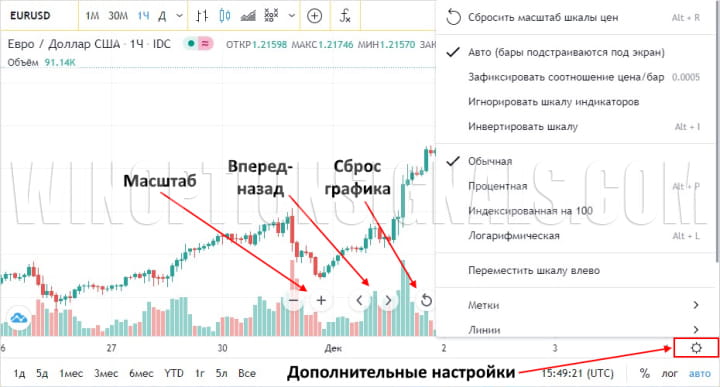
If for some reason you cannot reset the chart, you can do this with a special button that appears when the cursor is on the chart. You can also adjust the scale and move the graph back and forth.
In addition, there are additional settings that appear if you click on the “gear” in the lower right corner. There you can also:
- Reset scale;
- Adjust the scale ratio;
- Enable other price display;
- Add marks and lines;
- Enable or disable session boundaries.
Also, to conveniently position the windows with the broker’s trading terminal and the TradingView live chart, use the keyboard shortcut “Win” + right (or left) arrow (for Windows 8 and 10). The window with a live chart for online binary options will take up half the screen; you can easily move the trading platform to the free space. There will be no need to be nervous, constantly being distracted by collapsing and expanding tabs in the web terminal.
Conclusion: why should you use a live binary options chart online?
The live chart for binary options is very convenient and in terms of functionality it can only be compared with the specialized platforms ThinkOrSwim or MetaTrader 4/5, on which additional modules are installed. But the huge advantage of a live chart is that it does not require installing terminals or opening trading accounts with a broker, and it can be used anywhere and on any device that has the Internet and a browser.
Thanks to the live online chart, you can quickly analyze any trading asset without having a terminal, using both indicators and graphical tools. You can also analyze correlations between assets, take screenshots and conduct historical analysis.
Having studied all the functionality of such a chart, we can conclude that the TradingView live chart is the best choice for successful trading.

To leave a comment, you must register or log in to your account.