 There is an expression in financial markets - “Trend is your friend.” And while this phrase may make logical sense, in practice it is as opaque as can be. What is a trend in the Forex market and how to determine it for successful work on binary options ?
Table of contents
- What is a trend?
- Determining the trend.
- Using price movement to determine a trend.
- Moving Averages indicator for determining the trend.
- Bill Williams' fractal indicator for determining the trend.
- ADX indicator for determining the trend.
- Why do trends appear and what supports them?
- Effective trend trading.
- Conclusion.
What is a trend in binary options?
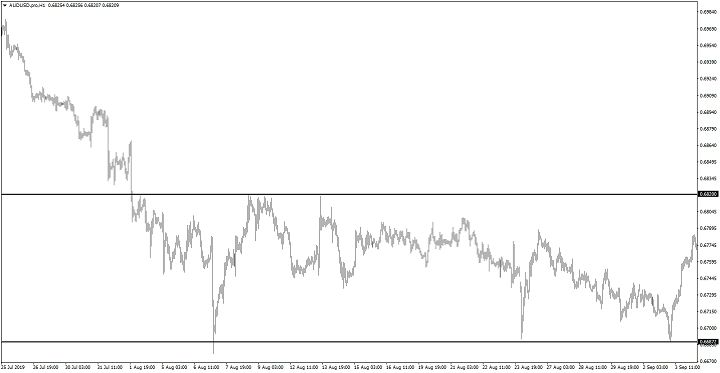
A trend in financial markets is the general direction in which market values or the price of an asset are changing. Trends can be upward ( bullish ), downward (bearish) or sideways ( flat ). There is no specific time frame in which a direction is considered a trend, but in general, the longer a direction persists, the stronger and more obvious the trend becomes.
Determining the trend in binary options
The easiest way to determine a trend is to observe the price behavior of an asset. Traders who trade using technical analysis believe that the information provided by a clean chart is sufficient to decipher the type of trend.
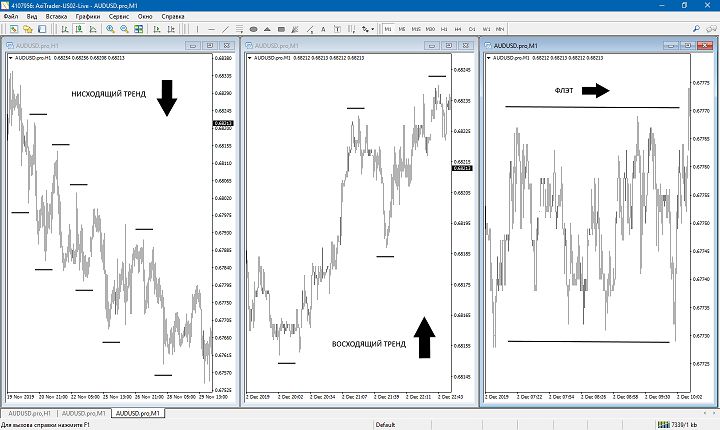
Definition of trend type:
- An upward (bullish) trend prevails in a market if the highs and lows (extremes) consistently rise or “grow.”
- A downward (bearish) trend prevails in the market if the highs and lows (extremes) consistently decrease or “fall.”
- A sideways (flat) trend prevails in the market if the highs and lows (extrema) are in the same price range between certain price zones.
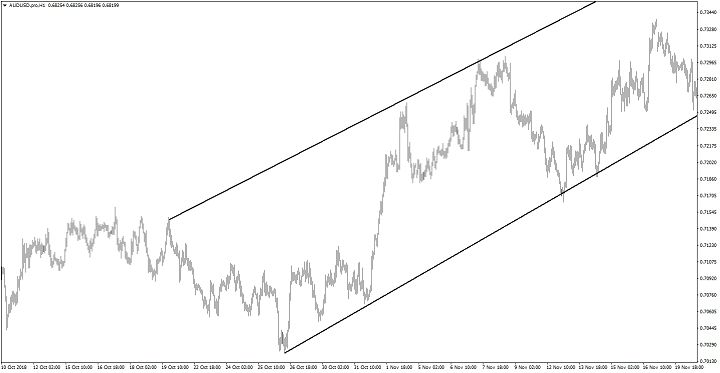
Using Price Action to Determine Trend
Trending markets (up and down) are ideal for swing traders who can set broad profit targets, while sideways (flat) markets are suitable for scalpers and intraday traders who are looking for quick profits by setting short profit targets . To select optimal entry and exit points, trend traders use trend lines and support and resistance zones .
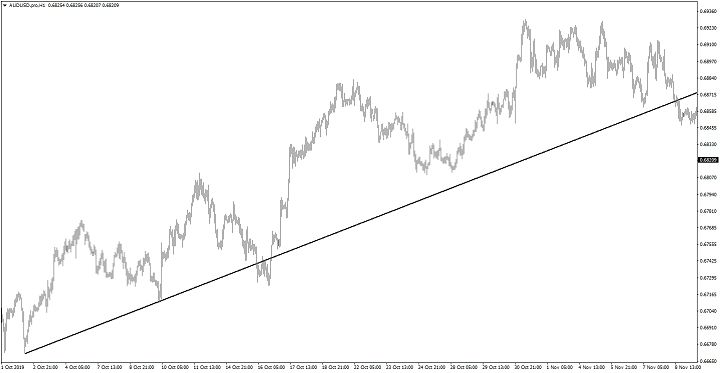
In an uptrend, a line is drawn from one specific price low, connecting it to another successive but higher low, projecting the line into the future (ray). This line acts as a dynamic support zone, with optimal Call entry points determined by the time price touches or approaches the trend line.
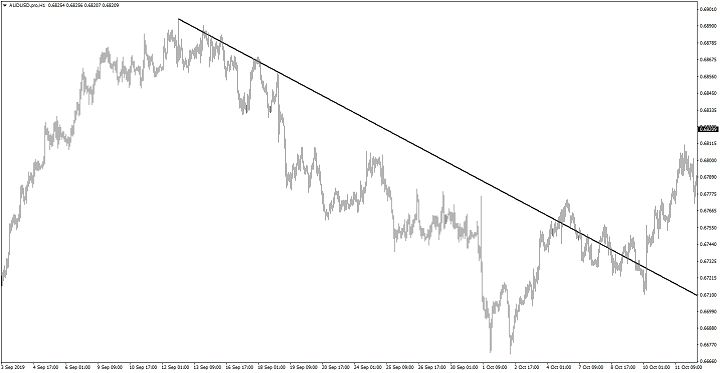
Conversely, for a downtrend, where a line is drawn from one specific price high, connecting it to another subsequent but lower high, projecting the line into the future (ray). The trend line then acts as a dynamic resistance zone line with optimal entry points (Put) determined by the time price touches or approaches the line.
In sideways trending markets, lines are drawn as horizontal zones along clearly defined support and resistance prices. Traders will look to place buy orders when the price is at or near the support line and sell orders when the price is at or near the resistance line.
But not all traders like “clean” charts. There are those who like to determine the trend for binary options trading using auxiliary tools. Next, let's talk about the main technical analysis indicators used to determine the trend.
Moving Averages indicator for determining the trend
Moving averages (SMA) are the oldest and undoubtedly the most popular technical analysis indicator. They not only help determine the direction of the trend, but also determine the momentum of the trend and possible reversals in the market. The moving average algorithm smoothes price movement, making it easy to determine the direction of the trend.
When prices hold above the moving average, it means that an uptrend is valid at the moment. Traders can determine trend momentum by observing the slope of the moving average. The steeper the slope of the moving average movement, the stronger the fall or rise in price.
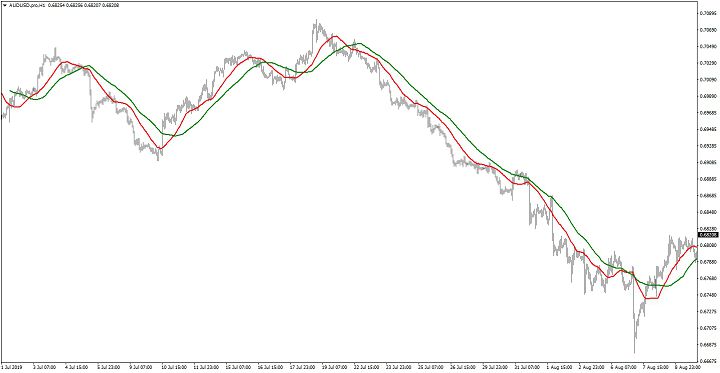
For further analysis, traders combine several moving averages. This way they can definitively confirm the prevailing trend, and also identify potential price reversals early enough.
When the faster moving average crosses above the slower one, the uptrend is confirmed, and when the faster moving average crosses downwards from the slower, the downtrend is confirmed.

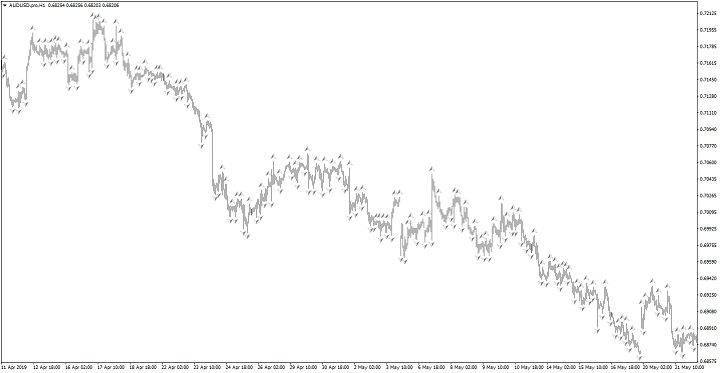
Bill Williams' fractal indicator for determining the trend in binary options
The idea behind this indicator is that markets are fractal in nature, and amidst the chaos there are repeating patterns that, if clearly identified, can help identify profitable trading opportunities. Bill Williams Fractals are a visual indicator that helps traders observe the cyclical movement of the market and identify good trend entry points, as well as identify potential trend reversals early enough.
We have on our website the “Trading Chaos” strategy by Bill Williams , adapted for binary options and including fractals.
A fractal shows extreme price levels between five periodic price bars. Thus, an ascending fractal has a middle candle with the highest high between two lower highs. Likewise, a downward fractal will have a middle candle with the lowest low between two higher lows.
Although this indicator is not decisive when making decisions in the market, it is more than enough to easily determine the direction of the trend. Simply by observing fractals, traders can determine whether the prevailing market condition is an uptrend, a downtrend, or even a sideways market.
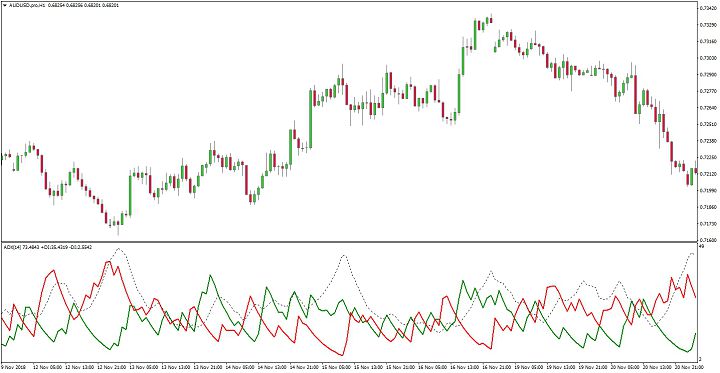
ADX indicator for determining the trend
The Average Directional Index (ADX) is a popular oscillator that helps determine the direction of a trend as well as the momentum of a trend. It fluctuates between the values 0 and 100. ADX also has a +DI (green line) and –DI (red line). When +DI is higher than -DI, it indicates an uptrend, and when -DI is higher than +DI, it indicates a downtrend. When the lines are close to each other, this signals a flat market.
It is also important to keep an eye on the center line (value 50). When ADX is above 50, it indicates a strong trend. When lower, it indicates that the movement is losing momentum, which can be an early signal of a possible trend change.
Why do trends appear and what supports them?
It is important to be able to identify and trade a trend, but it is also important to understand what creates and supports them. The main levers of influence on trends are the fundamental factors underlying finance and market sentiment.
As an example of the action of fundamental factors, we can consider the dynamics of a company's share prices, which may be a reflection of the economic power of this very company. If the price rises higher, it may be due to the company's success in executing its business plan or the forecast of future higher revenues and profits.
Currencies can rise or fall depending on the underlying country's interest rates, employment figures, trade and other economic factors.
To keep up with the latest important news, always use the economic calendar .
A trend can also be created and maintained by technical experts. The collective actions of traders around the world can determine areas of support and resistance.
For example, if in an uptrend the price breaks above a certain resistance level, most people will be inspired by this and join the movement on the move or increase their positions.
This will stimulate demand, which will support further growth, even without any noticeable changes in the economy.
Human emotions can also support market trends. Fear, greed and confidence are the main emotions that influence trader activity, and together they can determine the prevailing sentiment in the market.
If market participants feel collective fear, there will be negative sentiment in the market and, as a result, a bearish movement. On the other hand, if greed prevails, there will be a positive sentiment in the market and, as a result, an upward trend.
Effective trend trading
Identifying good moments to enter a trend position is not enough. Ultimately, the success of any trade will be determined by the exit point. When trading based on price movement in combination with trend lines, it would be best to use channels.
Channels are parallel trend lines drawn at both price lows and highs. The channels are ideal for placing targets. For example, in an uptrend, the top line represents areas where the price may begin to decline and this would be a good level to exit a buy order.
Conclusion
As we now know, trend is truly our friend. With it we can earn much more in the Forex market or with binary options. The end of a trend should not take you by surprise. With the correct application of price action techniques and the above useful indicators, you can be sure that you will trade with the trend as soon as the signals appear. If you follow all the rules, the trend will definitely reward you!

See also:
To leave a comment, you must register or log in to your account.